By Jessica Wyland
Runners (and race fans) take your mark. Today is the 2016 Boston Marathon, held every April on the Massachusetts holiday Patriots’ Day, which commemorates the start of the American Revolutionary War. It’s a spirited race, one that attracts about 30,000 runners, half a million spectators, and international media coverage.
Amid all the excitement, and new shoes, lurk safety concerns.
Take yourself back to spring 2013, the 117th running of the Boston Marathon. That day two bombs exploded at the finish line killing three people and wounding 260.
The following year marked record-high participation from runners and spectators under the rally cry: Boston Strong. By 2015, the Massachusetts Emergency Management Agency had produced the Boston Marathon Dashboard, an online map that tracks every aspect of the event as it happens.
The Boston Marathon Dashboard will help keep people safe today.
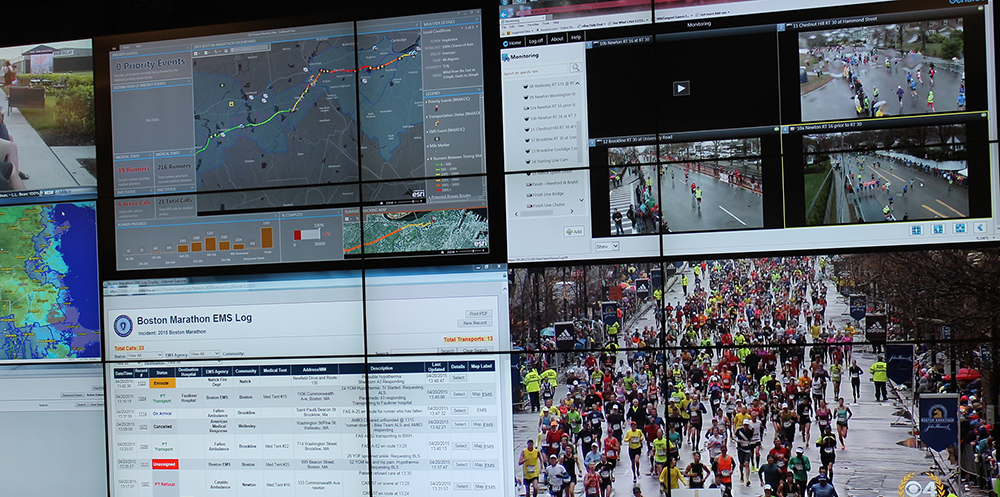
The technology behind the dashboard itself is remarkable: layers of real-time data, information that’s clickable and zoomable, a map that can be viewed and updated from any device by hundreds of people. But what matters most, even to the people who built and use the dashboard, is security assurances.
If the bombing attack left participants and spectators fearful, if it made police and public officials feel powerless, the Boston Marathon Dashboard could take away some of that fear and give people back a sense of control.
Desiree Kocis is the geographic information system (GIS) professional who built the Boston Marathon Dashboard. She is GIS coordinator for the Massachusetts Emergency Management Agency.
“The Boston Marathon bombing in 2013 showed us what data we needed to have online and not just on paper,” said Kocis. “I had never used ArcGIS Online, but I knew it was the only way to build the dashboard and push out all that information to so many different people.”
In just six weeks, Kocis learned how to use ArcGIS Online to build what turned out to be the highly successful Boston Marathon Dashboard. She used Operations Dashboard for ArcGIS, one of the apps included with ArcGIS Online.
The Boston Marathon Dashboard gives security personnel and emergency responders a real-time view and common operating picture, complete with live data feeds on runners, weather, traffic, emergency vehicles, and medical situations. It hosts 20 static layers that can be turned on or off as needed to show helicopter landing pads, National Guard staging areas, or medical facilities. In case of an emergency, all responders involved can quickly zoom in to emergency shelters to see status changes, capacities, key contacts, and phone numbers.
On race day, 300 people from 60 different agencies, including state and local police and the Federal Emergency Management Agency, use the dashboard at the Multi-Agency Coordination Center (MACC). Additional crews on the ground use Collector for ArcGIS app (also included in ArcGIS Online) on iPhones to locate nearby medical facilities when a runner falls or gets injured.
“People at the MACC genuinely care and are passionate in their duties,” Kocis said. “I’ve never felt so proud to be a part of something.”
insider