The Esri Brief
Get location tech news in your inbox
Trending articles


How many children in this neighborhood are hungry right now?
Why aren’t people from this county enrolling in a nutrition-assistance program?
How can I ensure that people in this neighborhood know about our services?
If we could eavesdrop on the minds of public sector leaders, we would hear questions just like these.
Health services, fire and rescue departments, and other public sector organizations see it as their mission to make life safer and healthier for their constituents. While their goals may be specific to social services, their public sector challenges parallel those in the business world. Reword the questions slightly, and they resemble a corporate executive’s dilemma:
Who and where are our potential customers? Why are some people familiar with our brand and others aren’t? How can we best reach them?
As digital transformation opens new opportunities across industries, corporate marketers are using powerful data and analytics to answer these questions, sifting through demographic, psychographic, and location data to unlock patterns of consumer behavior. In the public sector, innovative organizations are adopting and even building on these methods in their quest to improve services for their constituents.
A Campaign against Hunger
One such organization is California’s Department of Social Services, home to CalFresh, California’s version of the federal SNAP, or food stamp program. CalFresh provides eligible Californians—including children, parents, the elderly, and the disabled—with a monthly grocery stipend that averages $150 per person and $400 for a family. The funds come on a debit card that can be swiped to buy groceries at local stores and farmers’ markets.
Despite extensive marketing, CalFresh has one of the lowest enrollment rates in the country. The US average enrollment in state food stamp programs is 80 percent of eligible citizens; CalFresh clocks in around 70 percent, which translates into more than four million people.
Kim McCoy Wade, the CalFresh branch chief, is determined to improve the health of Californians, which means she needs that number to rise.
“In California, those 10 percentage points are a lot of low-income and hungry folks,” she explains. “So we started thinking about how we can find people who are eligible and likely to enroll.”

When you can predict where your fires are going to be and you understand the segments of the population with a higher prevalence of fire, you can focus your fire safety message where they work, live, and play.
Members of McCoy Wade’s team asked themselves, What are we doing in each of our program lanes to really change a family’s trajectory and give these children the opportunities we all want them to have?
This is where the CalFresh office departed from the standard course and sought innovative ways to connect with constituents.
A 360-Degree View of the Client
The organization adopted a whole-family approach, similar to the 360-degree view a business might take of its customers. Just as a marketing or sales team strives to understand a customer to identify cross sell and up sell opportunities, the CalFresh team wanted to upgrade its touch points with prospective enrollees.
McCoy Wade knew data would be key to creating this 360-degree view, and CalFresh had a valuable resource to tap: data maintained by sister programs within and outside the Department of Social Services.
In business terms, the team saw an opportunity to cross sell the benefits of CalFresh to participants in the Women, Infants and Children (WIC) nutrition program, which is run by the Department of Public Health and helps mothers and children aged zero to five secure healthier food.
“CalFresh and WIC had a mutual interest in connecting children and families with nutrition,” McCoy Wade explains. Indeed, many families who qualify for WIC also qualify for CalFresh, and vice versa, but the teams had been unable to compare enrollment data between programs.
“We had mission overlap,” says McCoy Wade. “We wanted to know who’s getting WIC and not CalFresh. And who’s getting CalFresh and not WIC.”
Like departments in a business, the two programs needed to undo data silos to take full advantage of the information on their servers. To do so, CalFresh and WIC reached a data-sharing agreement that protected their clients’ privacy while opening crucial information pathways.

“We call it in-reach,” explains McCoy Wade. “We want to use [data sharing] both for outreach at the community level and in-reach between government agencies.”
With the legal agreement in place, the programs ran a match between their datasets. CalFresh then performed a deeper analysis, using a geographic information system (GIS) to map the location of clients (masking personal and address information for privacy) by county, town, and even neighborhood.
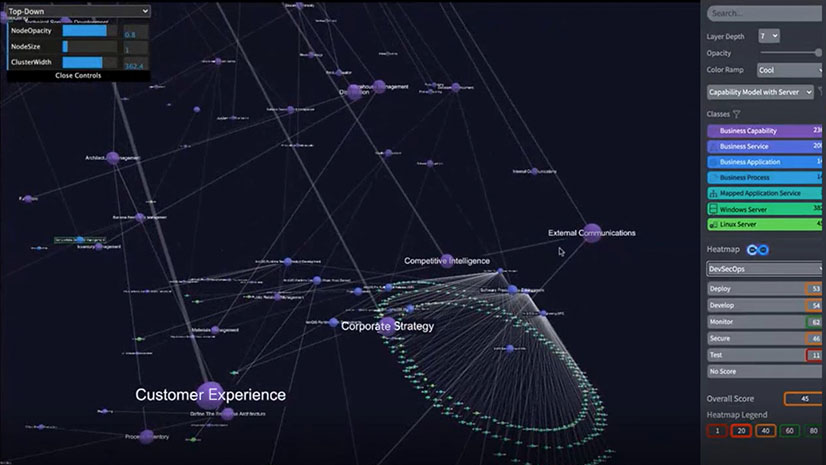
Just as a business executive would use GIS to compare sales or store performance across geographic areas, the team enlisted the technology to flag areas of successful CalFresh enrollment—as well as places where intervention was needed because of low participation. (See image at right for a snapshot of the findings.)
Location Analytics Comes to Life
Two findings, in particular, epitomized the importance of using location intelligence. One small, rural town in Santa Cruz County had 100 percent enrollment, an incredible anomaly in the world of social services. Meanwhile, a poverty-riddled area appeared as a dark spot on the map—a neighborhood with almost zero CalFresh users that should have had high enrollment given its demographics.

[Innovation] is really important for improving the lives of Californians. Programs directly touch people's lives. To the extent that we can improve benefits, that's what we should be doing.
McCoy Wade and her colleagues shared the mapped data with local CalFresh representatives in these areas, who helped explain the findings. An elementary school in the rural community had placed an emphasis on nutrition, planting gardens, and helping to enroll families in CalFresh and WIC. That inspired McCoy Wade and her team to explore whether the school’s engagement model could be exported as a best practice to urban locations.
The dark area turned out to be a former army base that had been converted to low-income housing but had not yet been connected to social services like CalFresh. The revelations from the location intelligence pushed the team to challenge itself, McCoy Wade says, by asking, How do we serve this community that was never intended to be easily accessible to social services but now needs that connection?

Those were two extreme cases, but there were many more. CalFresh found high numbers of eligible, unenrolled people in suburban towns, for example, a sign that poverty continues to shift geographically. There were communities with identical demographics but very different enrollment numbers. In each case, CalFresh representatives probed deeper, looking for root causes like a language barrier or a difference in local outreach techniques.
The results and the questions they raised have propelled CalFresh into the next phase: action and intervention. Like business managers scouting for best practices, local CalFresh offices are now combing through location data provided by the state office and proposing inventive plans for implementing change in their communities, family by family.
“We’re trying to create an environment where people experiment and innovate,” McCoy Wade says. “There will still be challenges and learnings and failures; we have to create space for that too. . . . But when you see the data, it really does help you focus your resources and overcome blind spots.” (See the sidebar for more on blind spots.)
Discovering Value in Location-Related Secrets
Across the continent, another public-service agency is borrowing techniques from the business world to advance a vital mission. In London, Ontario, Fire Chief John Kobarda is using location analytics and demographic targeting to change the city’s approach to firefighting.
London is home to just under 400,000 Canadians, about 120 miles from either Toronto or Detroit. Until a few years ago, the city’s fire service had focused primarily on improving its ability to extinguish fires once they occurred, as many North American fire departments do.
“It’s like making sure you have a lot of mechanics available to rebuild and repair engines,” Chief Kobarda says, “while discounting the benefit of changing the oil and preventative maintenance.”
Chief Kobarda decided to shift the department toward the first two lines of defense—education and prevention. “My focus was, how do we do things properly up front?” he explains. “It’s a cliché, but we should be trying to work ourselves out of a job.”
To do that, Kobarda employed GIS technology and location intelligence to understand where to focus the department’s resources. His team used GIS and demographic analysis to examine where fires were occurring; if there was a pattern to their causes, then perhaps London Fire could reach people with prevention efforts.
First, GIS helped them map the locations of two types of fires—those related to smoking and cooking—whether the cause was carelessness or an accident. The technology then helped the team see who lived in those locations—their median age, what they did for leisure, where they shopped, their mobile device habits, and more.
This approach is well-known in the private sector, where corporate marketers rely on sophisticated demographic and psychographic analysis to identify which segments of the population might gravitate to a company’s products and services or shop its stores.
To start its analysis, London Fire used GIS to create a heat map showing the locations of fires from 2010 to 2013. Kobarda and his colleagues immediately saw that 55 percent of London’s fires occurred in areas housing just 38 percent of its population.
“Those concentrations then drove us to say, Why do we have more fires in these locations? Then we started saying, Well, who lives there? And that’s where the [demographics] piece came in,” Kobarda explains.
The Who and Where Behind Residential Fires
In a separate analysis, London Fire enlisted an outside firm to perform a market segmentation. The firm found that of the 68 demographic groups in the Canadian population, five have a significantly higher association with residential fires. Interestingly, another analysis found that these same five segments have a higher prevalence of fire in other Ontario municipalities as well. Turning back to the GIS heat map, Kobarda and his team confirmed that those groups were overrepresented in the London areas with a high incidence of fires. Characteristics of these groups might include a high prevalence of smoking, or heavy mobile device usage that can cause distraction when cooking, and so on.

I think there's a trend of the sectors collaborating more. [They're] finding a common purpose—whatever they're focused on—whether that's in human services or health care or other industries.
In 2013, London Fire began deploying geotargeted fire prevention marketing within the city, segmenting its messaging by demographic factors, such as age and lifestyle habits, and delivering them not just on billboards and bus stops but on posters in bars and clubs, too. By the end of the year, residential fires had decreased by 22 percent. Annually, the $120,000 fire-safety marketing program is estimated to provide over 71 million possible impressions.
“When you know where your fires are going to be, you know where you can market,” Kobarda explains. He recalls telling the London Fire story to a gathering of the National Fire Protection Association. Afterward, a researcher who previously worked for Fortune 500 companies stood up to comment. “This stuff works,” Kobarda remembers the man saying. “I’ve used it in the private sector to sell more products. London has just taken and twisted it to teach people to be safer versus to teach people to buy.”
Innovation in the Right Place
The sharing of ideas and innovation across sectors isn’t new, but as new technologies and techniques emerge, private and public leaders are collaborating more frequently.

When you see the data, it really does help you focus your resources and overcome blind spots.
“I think there’s a trend of the sectors collaborating more,” says Niles Friedman, a fellow with FUSE Corps, a nonprofit that places business professionals in government to stir innovative problem solving. “[They’re] finding a common purpose—whatever they’re focused on—whether that’s in human services or health care or other industries.” As part of a FUSE Corps placement, Friedman is working as a senior innovation adviser to the California Health and Human Services Agency (CHHS), home to CalFresh, WIC, and many other public programs. With Friedman’s help, CHHS has set up an Innovation Office, enabling the agency to experiment with technologies like GIS and location intelligence and encourage collaboration across the entire organization.
Mike Wilkening, undersecretary of CHHS, believes that public organizations have an obligation, even a duty, to take advantage of innovative practices. Wilkening oversaw the creation of an open data portal for CHHS and was instrumental in introducing innovation fellows, like Friedman, to the agency.
“[Innovation] is really important for improving the lives of Californians,” says Wilkening, who is acutely aware that his work affects millions of people in California each day. “Programs directly touch people’s lives. To the extent that we can improve benefits, that’s what we should be doing.”
With today’s drive for efficiency and resource optimization, innovative use of location technology will continue to spread across the public sector, as it has across the business world. Whether organizations are sharing data, analyzing geographic areas for constituent hot spots, performing side-by-side evaluations of local office performance, or mining demographic and psychographic data to design targeted messaging, the public sector has the potential to impact millions of lives with location intelligence and advanced analytics.
As a 2013 McKinsey article put it, “Results-oriented governments are increasingly making use of hard data and statistical analysis to inform decisions.”
By leveraging enterprise GIS technology to take a sophisticated approach to location intelligence, demographics, psychographics, and more, public sector leaders are disrupting the status quo—with the ultimate goal of maximizing productivity and efficiency and, in so doing, impacting the lives of more and more people in their cities and communities every day.