The Esri Brief
Get location tech news in your inbox
Trending articles


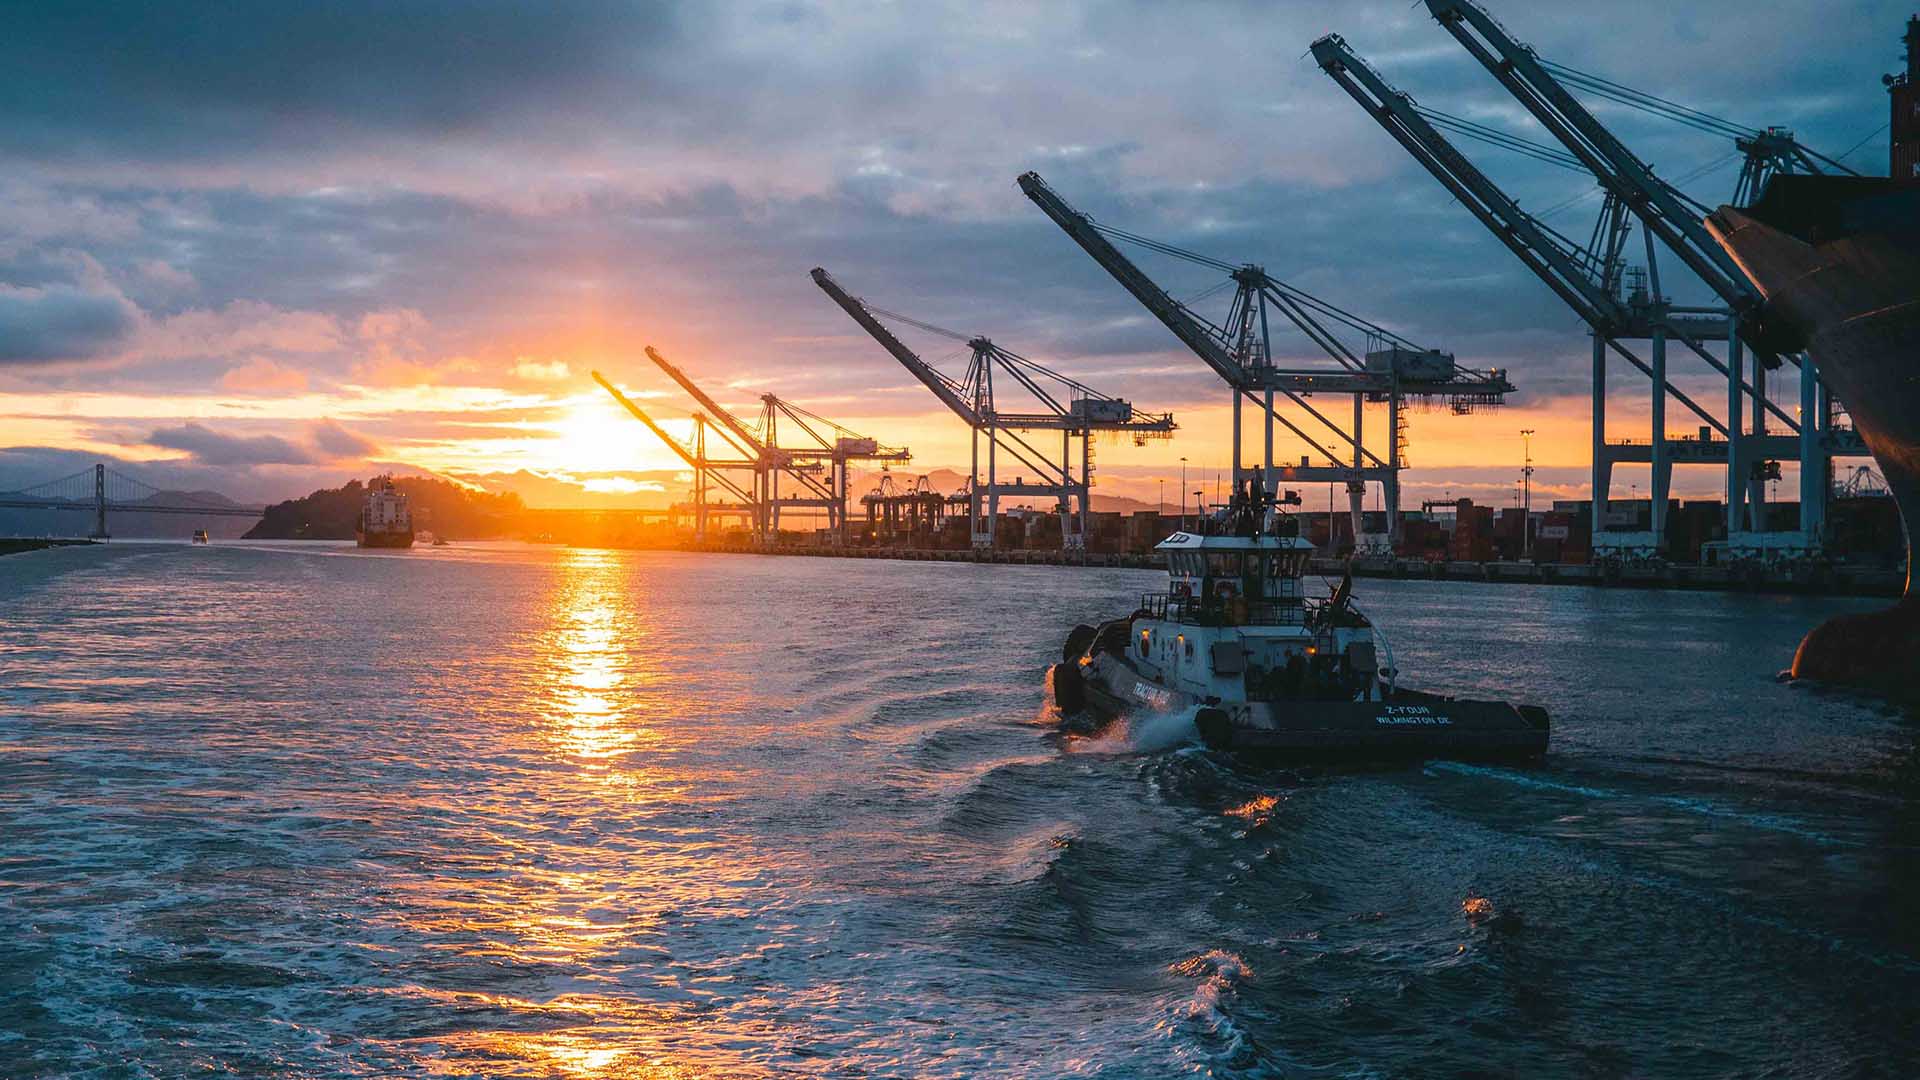
It was a wake-up call like no other: Ask a global supply chain executive or COO what types of scenarios keep them up at night, and there’s a good chance you’ll hear about the 2011 floods in Thailand.
Monsoonal rains and tropical storms led to the worst flooding the southeast Asian country had seen in 50 years. One of the worst-hit areas was the Chao Phraya River basin located near Bangkok: a manufacturing powerhouse that produces up to a third of the world’s hard drives.
The weather-related destabilization ricocheted throughout the global supply chain. Losses inside Thailand totaled as much as $50 billion as industrial output in the area was halved. Japanese car manufacturers operating facilities there had to suspend production, resulting in major profit losses. In response to flood-related stoppages, Sony downgraded its full-year operating profit outlook by 90 percent. HP said it would experience hard drive shortages through Q2 of 2012.
Business leaders have learned a lot about supply chain vulnerabilities since, but the danger of global supply chain disruptions due to extreme weather, in particular, continues to grow.
With the volume of manufacturing currently concentrated in China, for example, 50- or 100-year floods there could dwarf the effects of Thailand’s 2011 floods. US officials saw flooding outside Wuhan delay shipments of much-needed PPE last year. These conditions underscore the importance of businesses having access to granular information about how weather patterns intersect with factories, supplier facilities, and global supply chain routes.
Global Supply Chain Resilience Grounded in Data
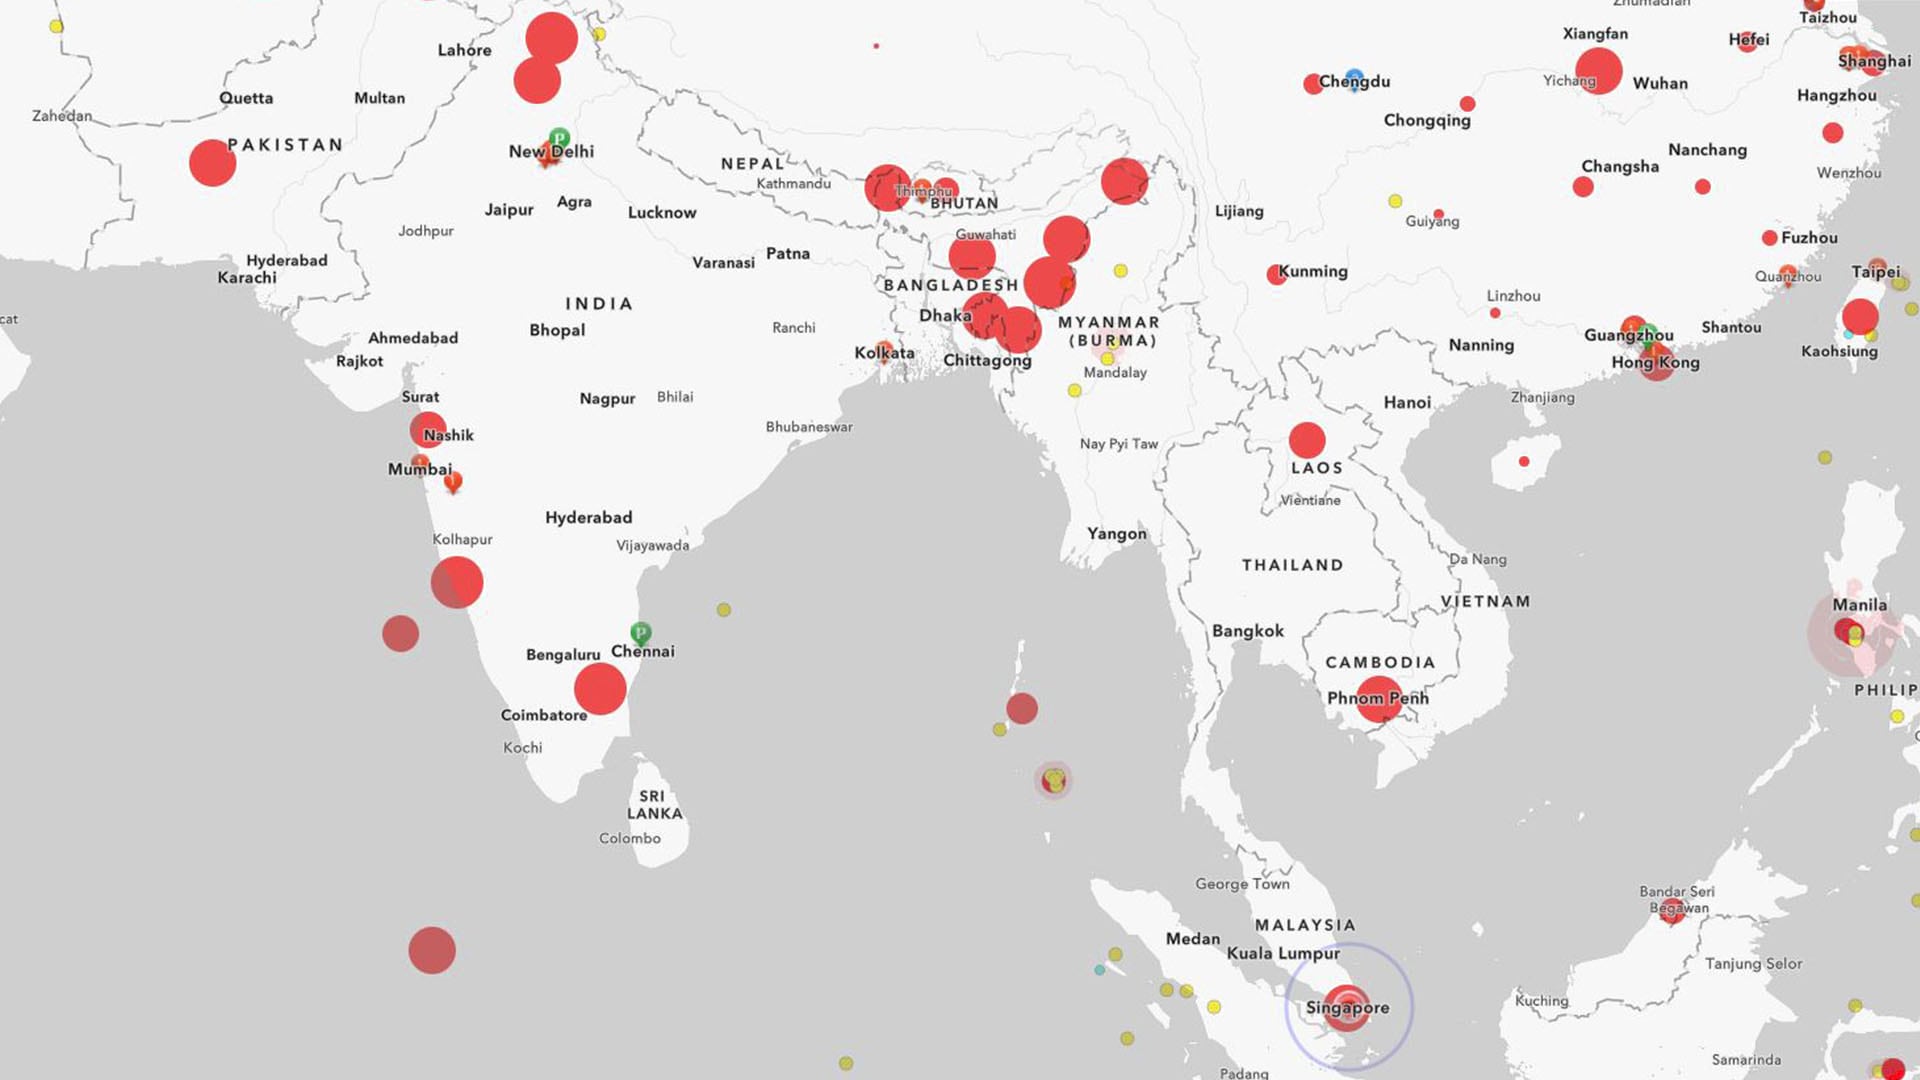
In today’s economic landscape, business resilience begins with awareness, and awareness begins with data. For an executive overseeing a global supply chain, a dashboard powered by a geographic information system (GIS) provides a way to organize data and contextualize the location and magnitude of potential impacts.
This video demonstrates the practical use of a dashboard in monitoring a global supply chain across a variety of factors, from weather to COVID-19 cases to fires.
The interactive map allows a decision-maker to absorb data quickly: Pins indicate the status of facilities stretching across the company’s global footprint. Green and blue dots indicate plants and tier 1 and tier 2 suppliers operating normally, while red dots signal operations facing threats.
Executives can see not only how many plants have been disrupted but the consequences of these disruptions, including the percentage of affected parts or finished goods.
Clicking on a facility produces a window with data on the location’s number of employees, typical daily production volume, and risk measures for events like floods. An executive trying to determine the possible impacts of a coming storm can zoom in and gauge the distance to coastlines or nearby facilities that could serve as temporary storage if a warehouse is knocked offline.
Awareness to Mitigate Losses
A McKinsey study found that firms that plan ahead for climate-related incidents can limit revenue losses to 5 percent, versus losses of 35 percent for unprepared players.
GIS technology provides business decision-makers with situational awareness through location intelligence, weaving layers of information into one view. Real-time data on weather threats, the status of facilities, and patterns of past storms act like an intelligent nervous system that helps C-suite leaders understand the impacts and know how to respond effectively and quickly.
GIS-based smart maps can even forecast weather impacts on a specific product component or raw material, allowing organizations to issue warnings or shift production to secondary suppliers. Companies including AT&T and one of the world’s largest retailers rely on GIS analysis to understand weather-related threats across networks of stores or cell towers.
Seeing the Threat Matrix in the Global Supply Chain
By toggling data layers on or off, an executive can study threats posed to specific geographic areas or particular tiers of the supply chain.
If flooding is threatening the east coast of Asia, an executive can focus on that region and consult infographics alongside the map to see how many plants and suppliers will be affected. By tracking the goods and components produced by each facility in the supply chain, a GIS dashboard reveals how downtime at a plant producing fasteners or seat levers will affect the flow of finished goods at a factory thousands of miles away.
With GIS technology, decision-makers can also turn on data like COVID infection rates to understand other risks to the business.
Each piece of supply chain data is useful on its own, but data becomes more valuable when viewed in the context of geography and broader impact. GIS dashboards create that comprehensive view, pulling together multiple data sources and yielding the insight that businesses need to build resilient supply chains that are as agile as they are efficient.