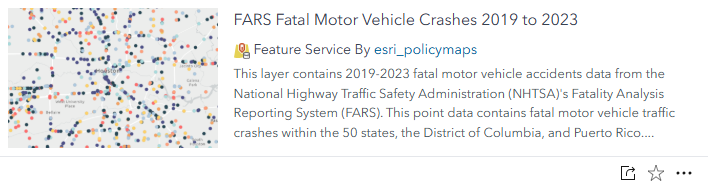
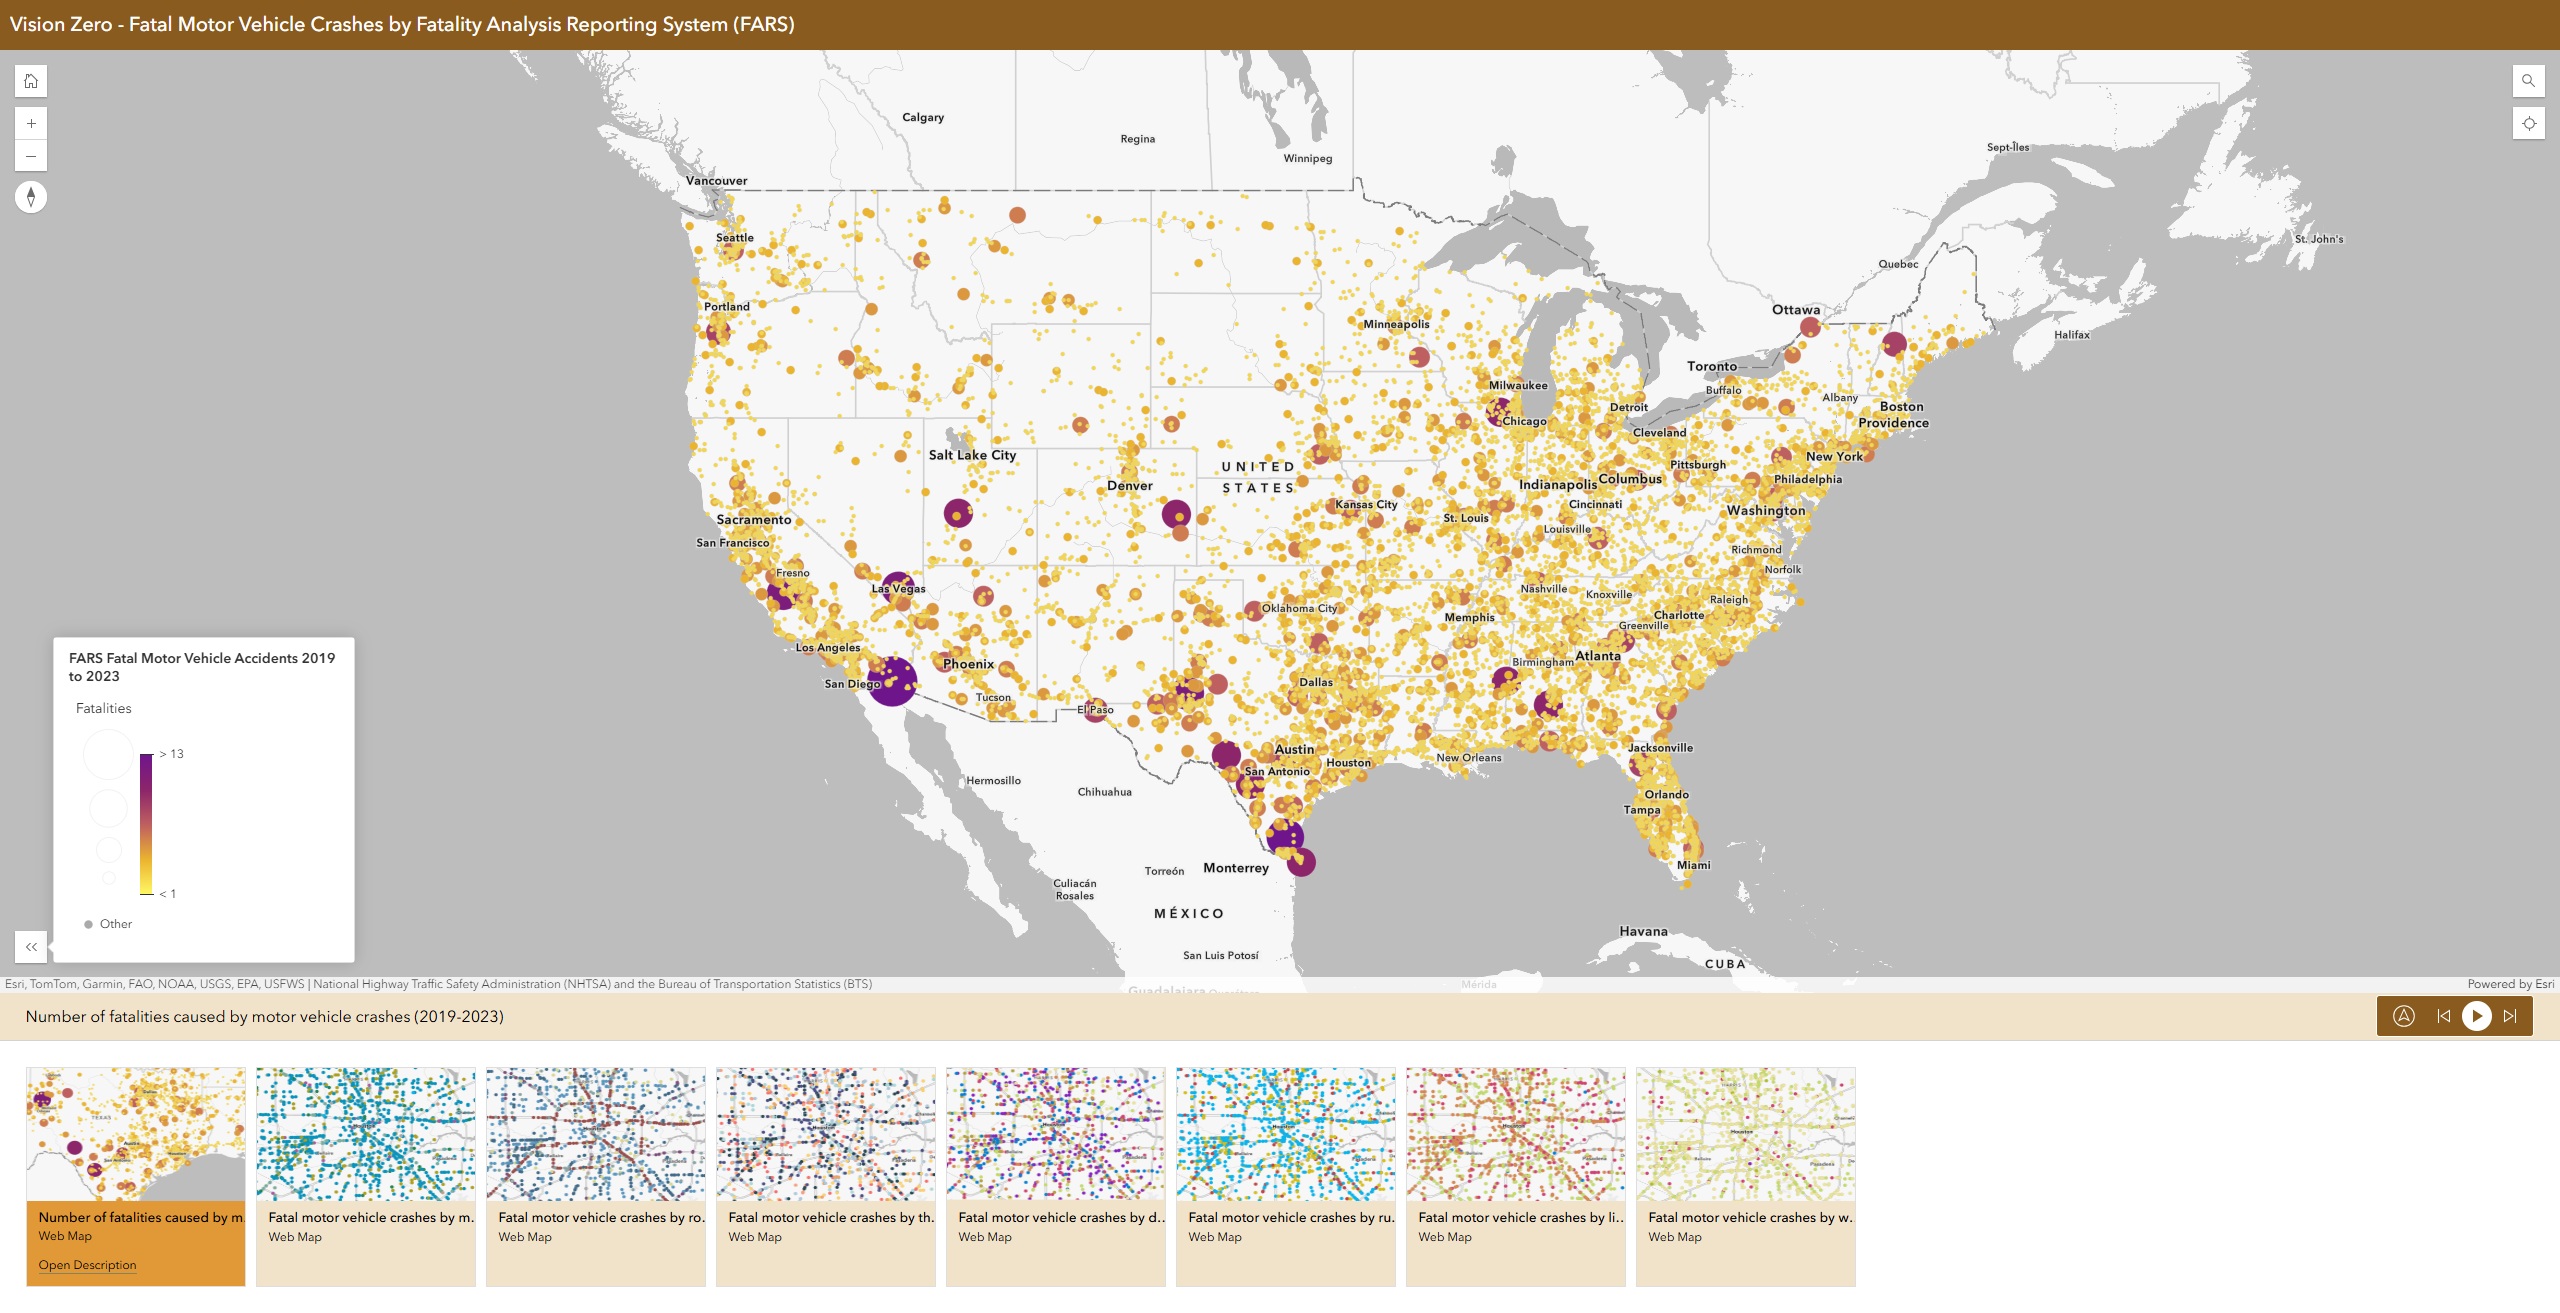
Understanding where and how fatal motor vehicle crashes occur is crucial to making roads safer, informing public policy, and supporting transportation planning. A new feature layer sourced from the National Highway Traffic Safety Administration (NHTSA)’s Fatality Analysis Reporting System (FARS) is now available in ArcGIS Living Atlas of the World, providing data on motor vehicle fatal crashes from 2019 through 2023, across the United States.
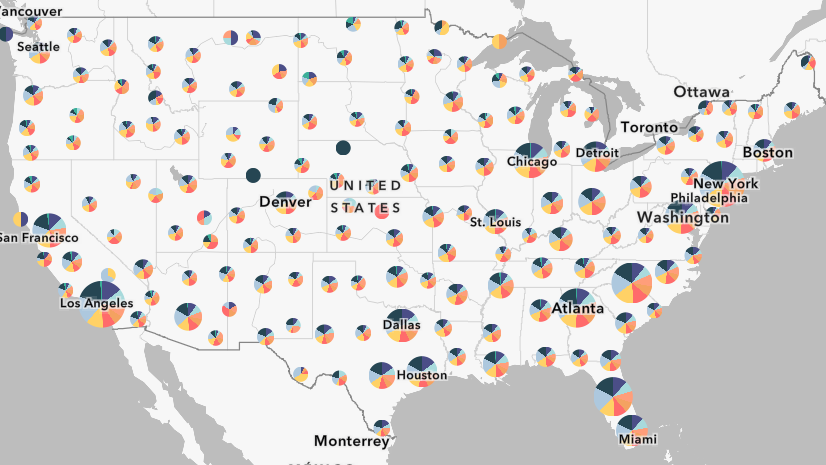
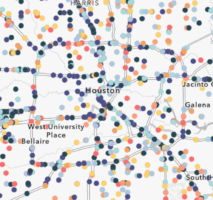
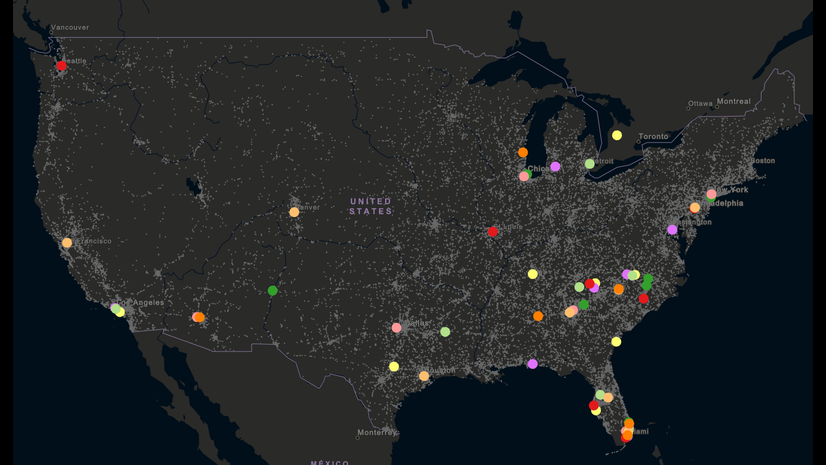
By default, the layer is symbolized at larger extents, such as nation to county levels to show the distribution of fatal crashes by time of day using clustering. As you zoom into local levels, individual point locations of fatal crashes are displayed to show the location and time of day that a fatal crash took place.
The FARS Fatal Motor Vehicle Crashes 2019 to 2023 layer, along with several web maps and an accompanying dashboard are all available in Living Atlas to help support the GIS community in advancing transportation safety toward the goal of zero motor vehicle deaths.
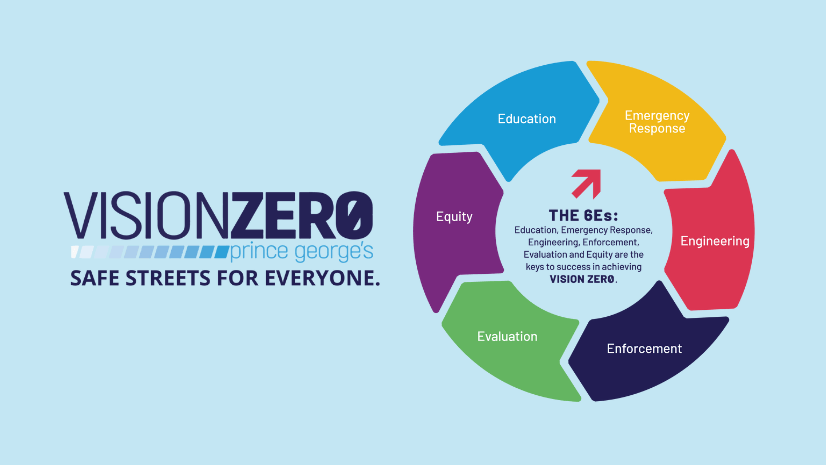
This goal, shared by Vision Zero and the U.S. Department of Transportation’s Federal Highway Administration’s Safe System Approach, acknowledges that while reaching zero deaths may be an ambitious goal, no loss of life on our roads is acceptable—and it is a collective effort to systematically eliminate traffic fatalities and serious injuries.
What is FARS?
The Fatality Analysis Reporting System is a nationwide census of motor vehicle traffic crashes that result in the death of a vehicle occupant or a non-motorist (such as a pedestrian or cyclist) within 30 days of the crash. Operated by NHTSA, the program collects and standardizes crash data reported by law enforcement agencies across all 50 states, the District of Columbia, and Puerto Rico.
FARS data are obtained solely from the States’ existing documents:
- Police Crash Reports
- Crash Report Supplements
- State Vehicle Registration Files
- State Driver Records
- State Roadway Classification Data
- Death Certificates
- Toxicology Reports
- Emergency Medical Service Reports
What the Layer Includes
This new Fatal Motor Vehicle Crashes layer provides detailed geospatial information for fatal crashes, including:
- Precise crash location, including latitude/longitude, address of crash
- Time of crash, including hour, minute, day, day of week, month, year, rush-hour status, daytime vs nighttime, etc.
- Driving conditions, such as weather and lighting conditions
- Roadway information, such as the type of road classification system and whether the crash occurred at an intersection or junction
- Number and type of vehicles involved such as pedestrians, cyclists, motorists
- Driver condition, such as alcohol or drug use, drowsiness, or distracted driving
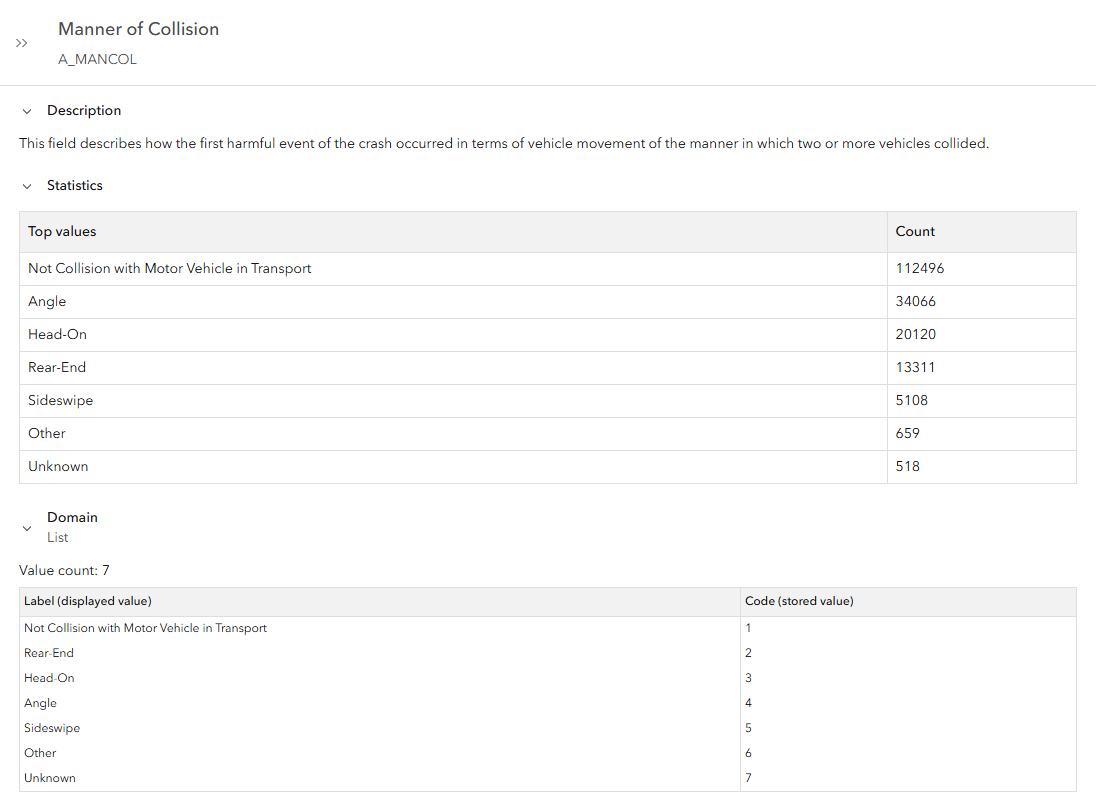
- Manner of collision, such as vehicle-to-vehicle collision, non-vehicle collision, angle of collision, etc.
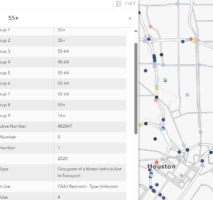
Each record includes a rich set of attributes to support in-depth analysis of crash patterns and contributing risk factors.
View an example of these attributes symbolized below. Click on the image to open the portfolio app in a new tab.
Living Atlas value-adds for GIS users
The feature layers have all the details and enhancements you’d expect from Living Atlas:
- Informative aliases and field descriptions
- Domain fields to help users more easily interpret attribute values
- Clustering symbology to show the distribution of types of crashes at the national level
- Individual points of data symbolized at local levels
- Additional fields calculated such as Date of Crash, Rush Hour, Time of Crash (in 3-hour intervals)
- Multiple years of data merged to see patterns over time
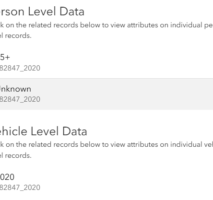
- Related tables from the person-level and vehicle-level auxiliary files to add additional context on individual records of people and vehicles involved in a crash
How You Can Use It
Transportation analysts, safety planners, and GIS professionals can use this layer to:
- Identify high-crash corridors and intersections
- Monitor safety trends over time
- Support Vision Zero, Safe Streets and High Injury Network initiatives
- Integrate with demographic and traffic volume layers for risk analysis
- Create compelling data visualizations and story maps
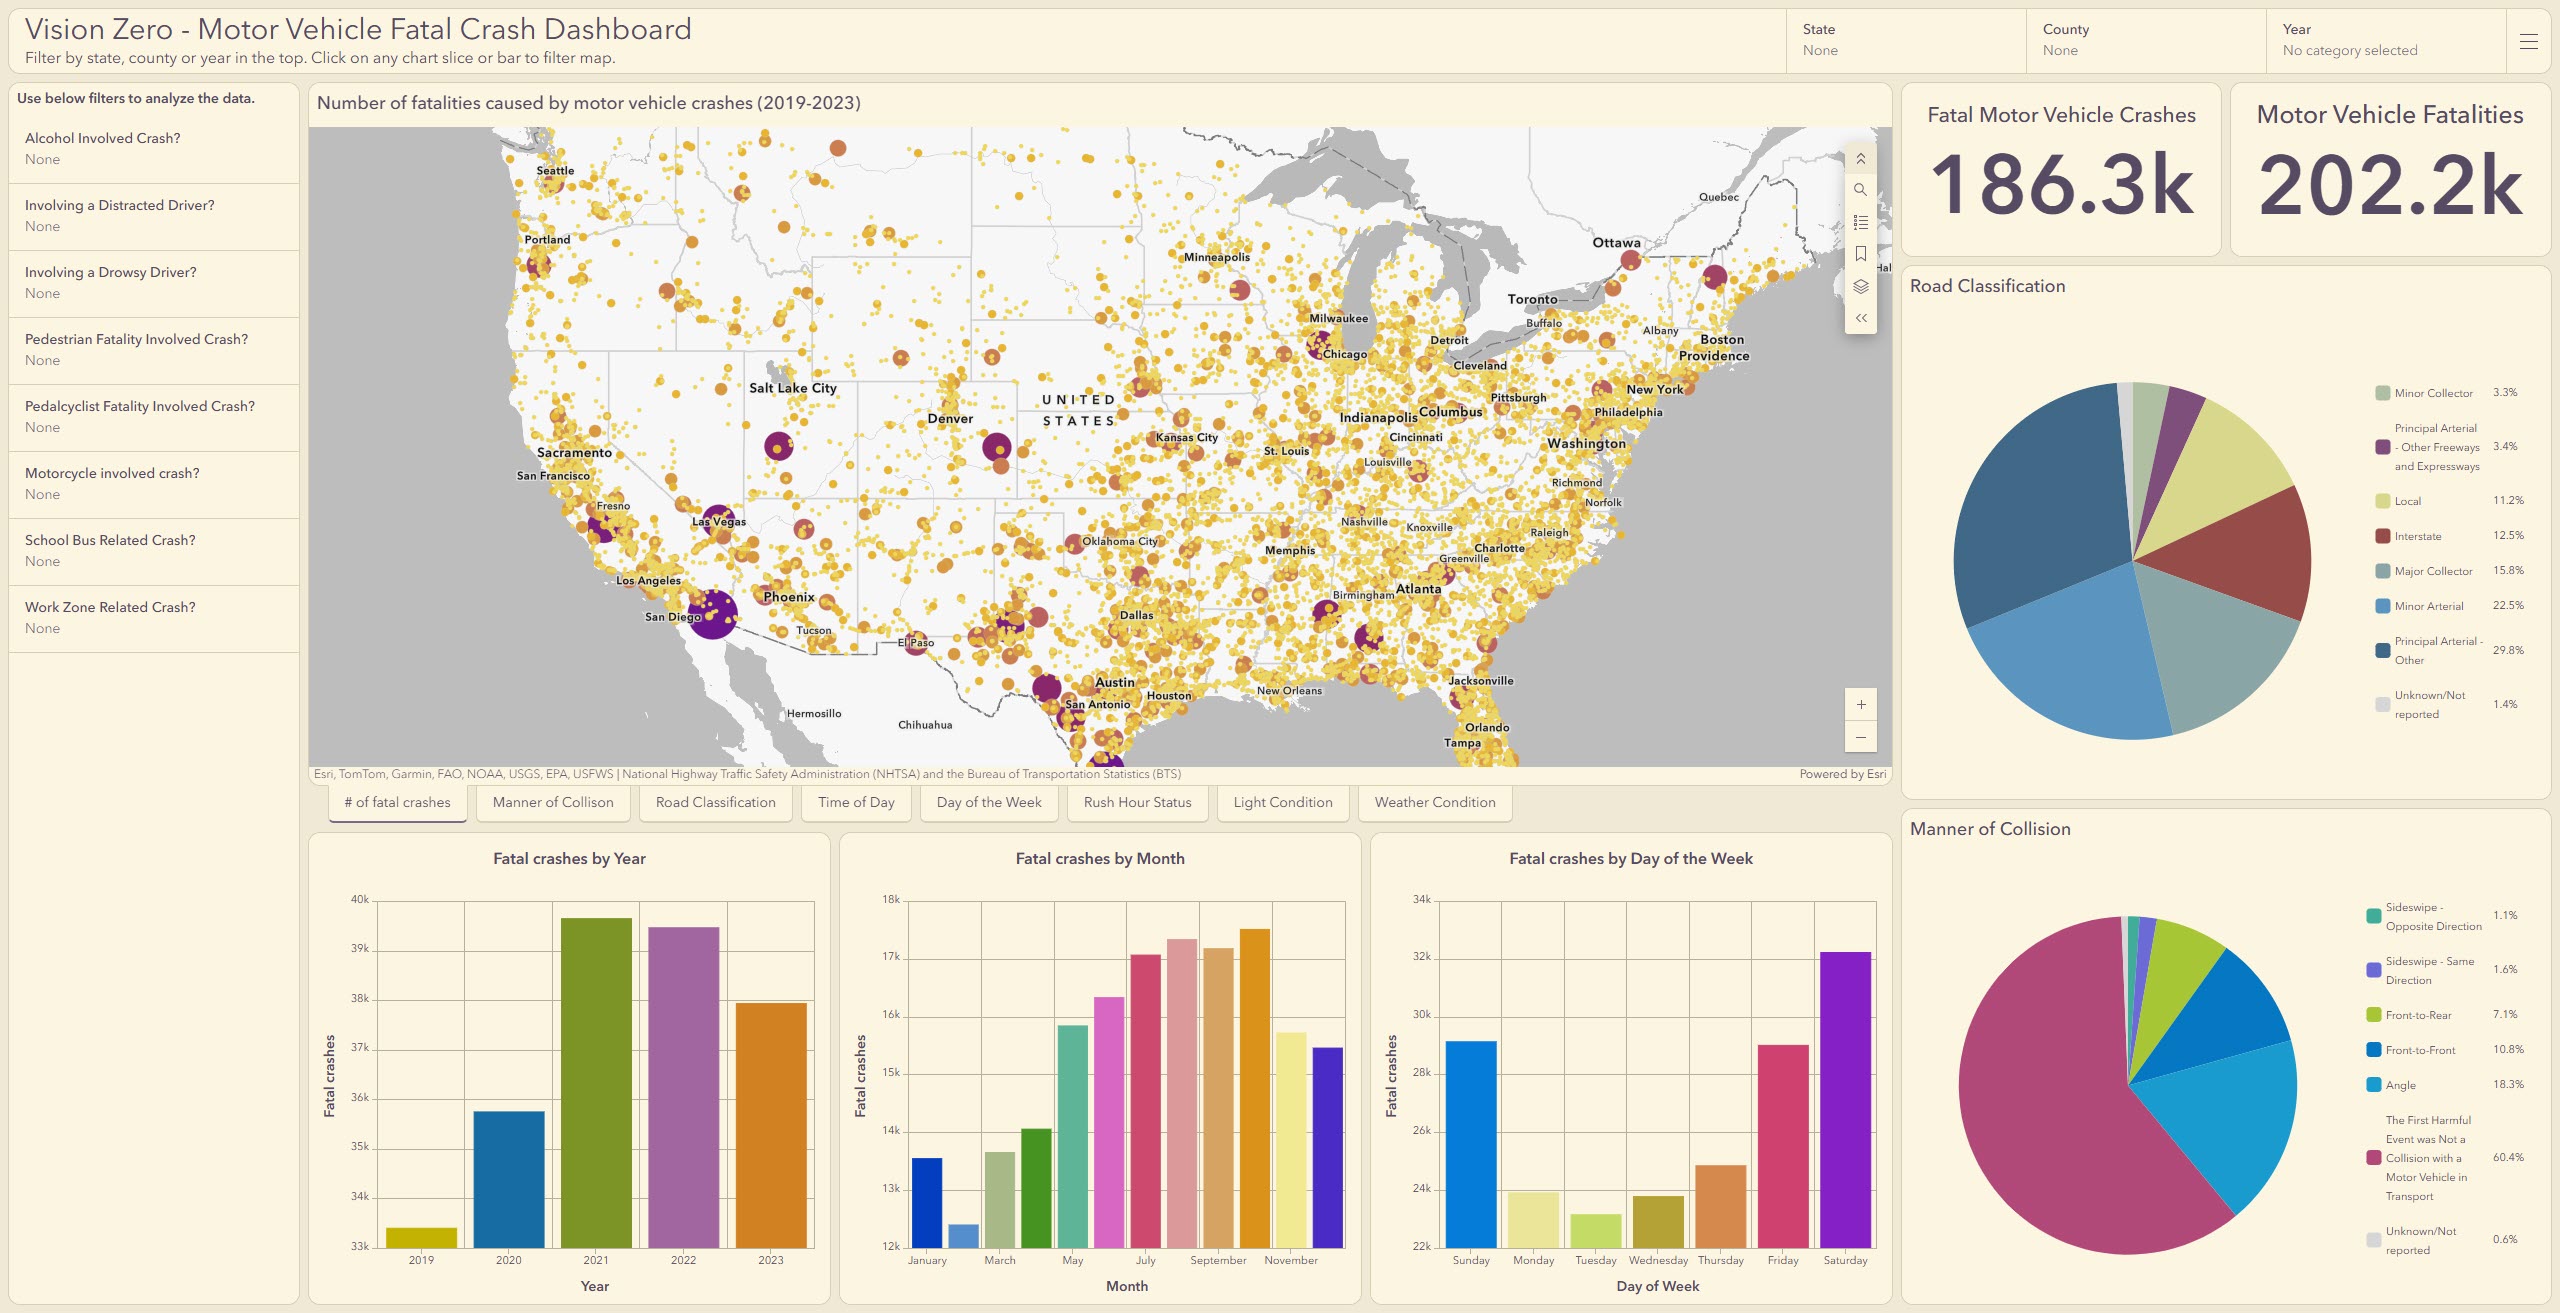
Use this ArcGIS Dashboard below to interact with multiple attribute filters, maps and charts. See the distribution of crashes by time, geography, type of people involved (e.g., pedestrians, cyclists, drivers), driver conditions, and many other attributes.
Try It in Your Workflows
You can add the Fatal Motor Vehicle Crash layer directly into your ArcGIS projects, use it in ArcGIS Dashboards, or bring it into ArcGIS StoryMaps to communicate safety trends to stakeholders and the public.
- Add to your map in ArcGIS Online with your own supplemental data
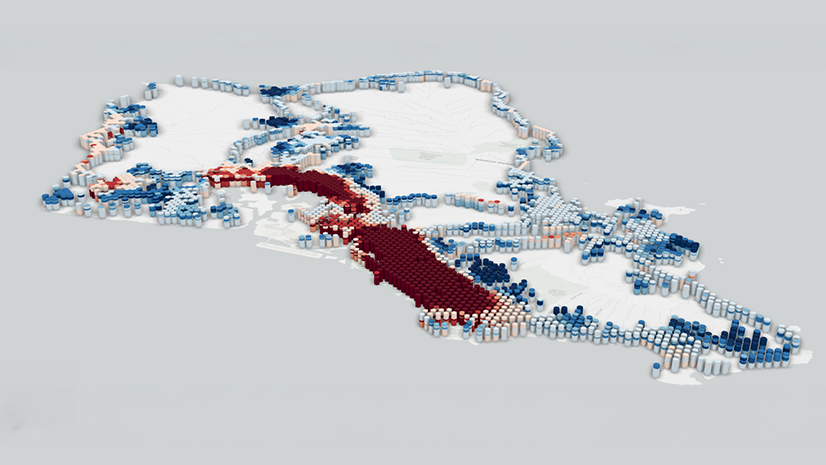
- Analyze crashes in space and time using the Space Time Cubes tool in ArcGIS Pro
- Create custom dashboards and reports
- Deploy this data in the Traffic Crash Analysis Solution


Article Discussion: