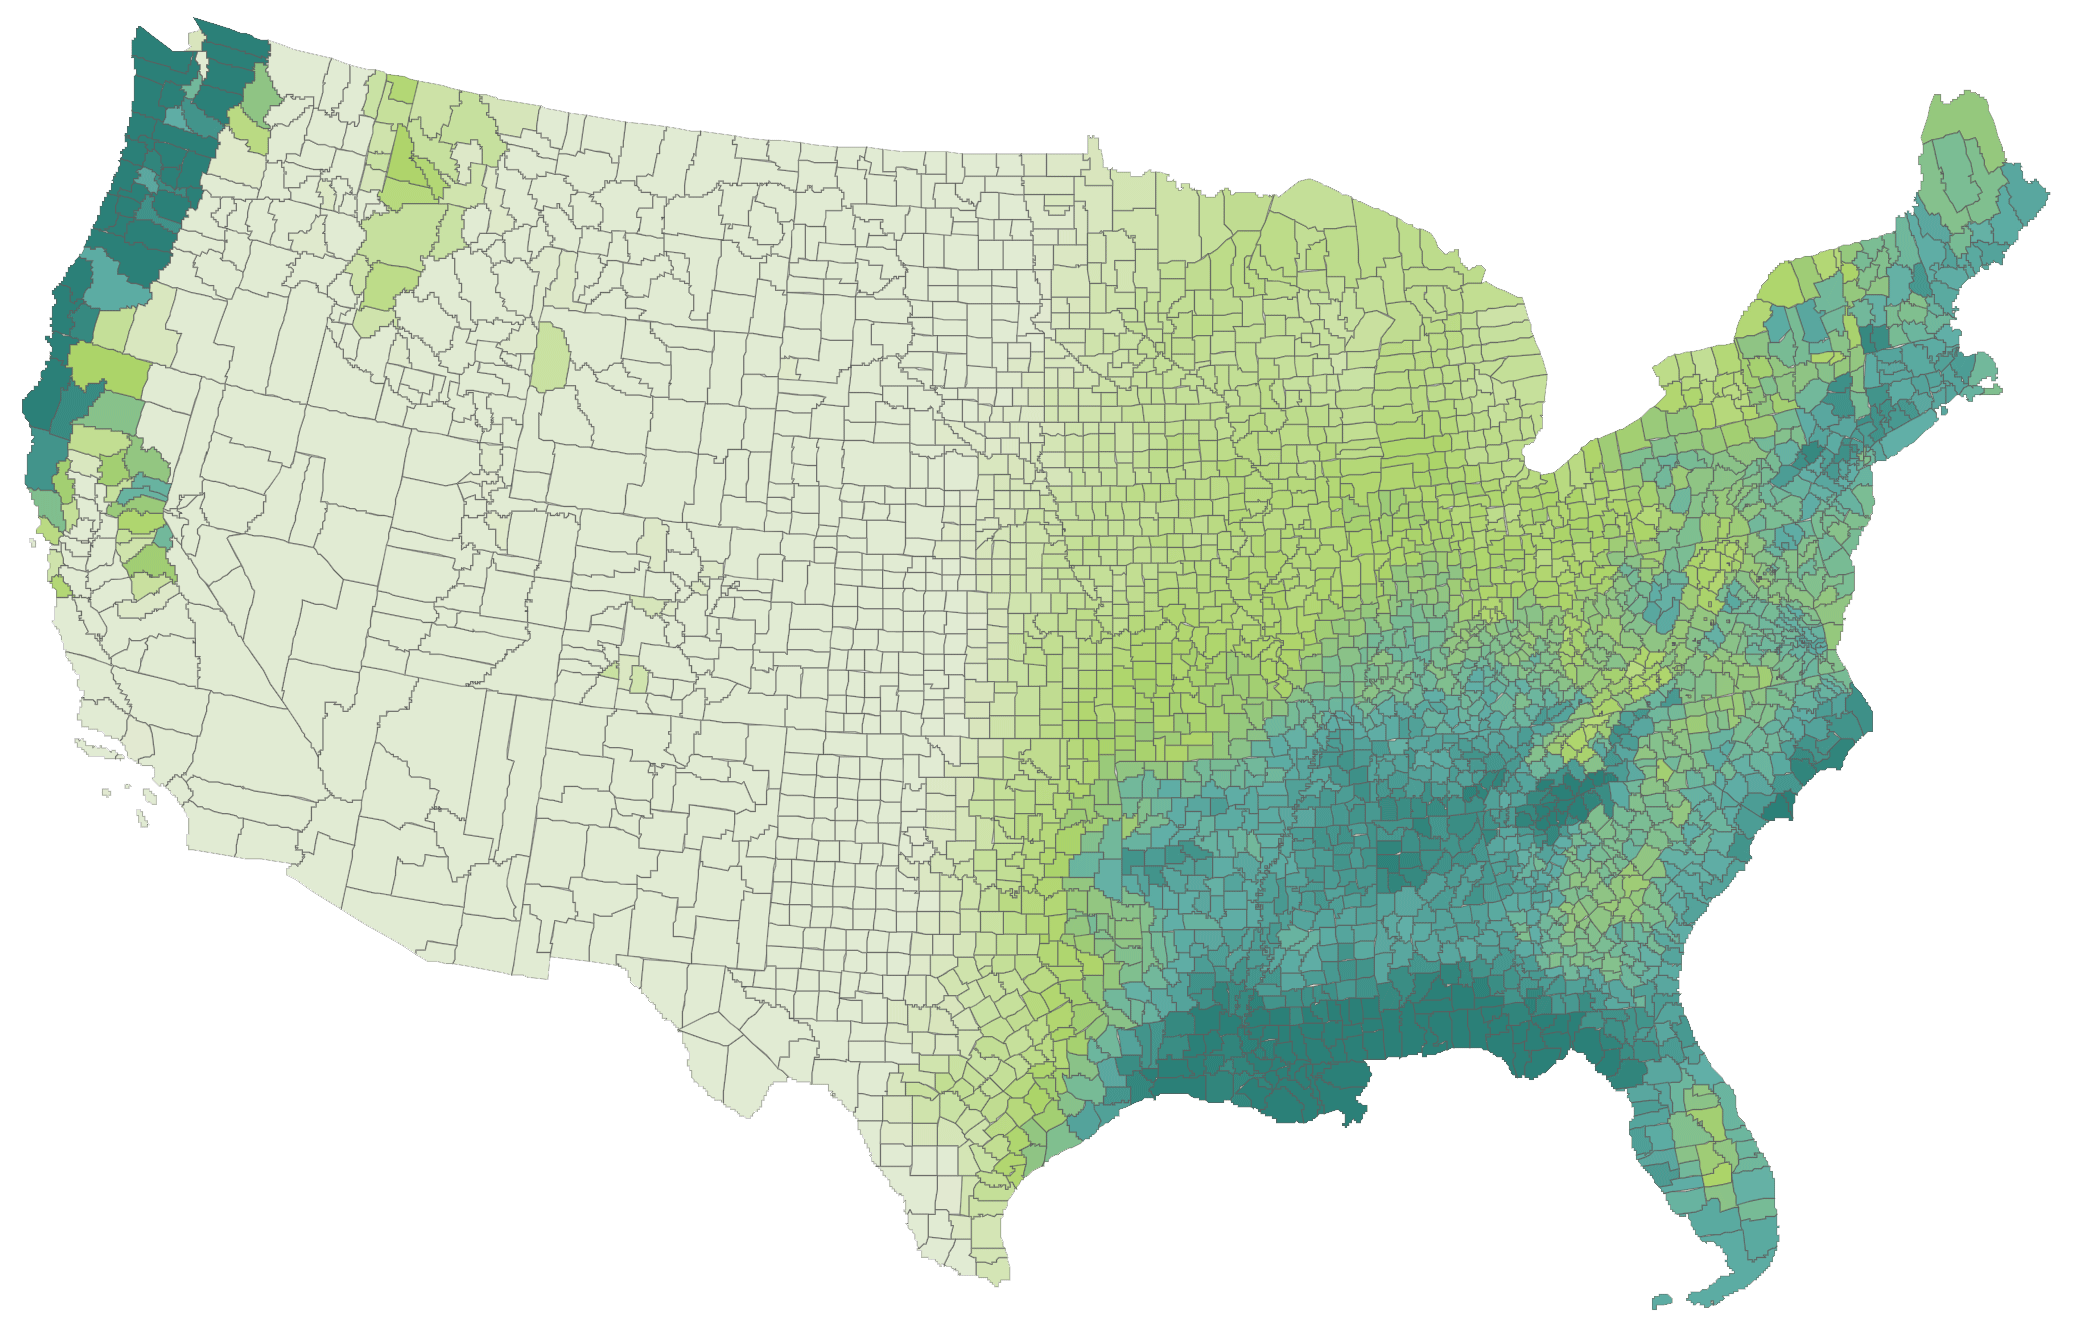
Understanding how temperature and precipitation may change in the future is a key part of the Steps to Resilience and building more climate-smart communities. We are excited that NOAA has contributed the latest climate projections, LOCA2, to the Living Atlas that were developed for the 5th National Climate Assessment (NCA5).
The new climate projections are a part of the U.S. Climate Resilience Information System (where you can find even more data and developer tools). They provide 43 thresholds of temperature and precipitation for the Contiguous United States for multiple climate scenarios, times, and geographies. NOAA is planning to expand the coverage to Alaska and Hawaii over the next year.
To create the layers, researchers at UC San Diego downscaled output from sixteen individual CMIP6 global climate models from ~100-km to 6-km. NOAA and colleagues at CICS-NC calculated decision-relevant thresholds and combined that data into a weighted ensemble. LOCA2 replaces the older LOCA (downscaled CMIP5) projections previously available in the Living Atlas.
Besides the geographically summarized data, the original gridded data is available as image services.

Considerations when using the data
Climate projection data is incredibly nuanced. Please review the item descriptions and further documentation in the Climate Resilience Information System before incorporating the layers into real-world applications.
- While many variables are calculated to show critical values of temperature and precipitation, the data are averaged over space, time, and climate models, thereby reducing (or “numbing”) the most extreme values. Isolated extreme weather events like 26” of rainfall in 24-hours in Ft Lauderdale are not captured by a weighted mean of multiple climate models. Considering relative change can be more meaningful than absolute change.
- While the data is distributed in yearly or decadal time steps, it is best to use multi-decadal averages to reduce the inherent uncertainty of the models.
- The gridded image services are intended to support creating other customized geographic summaries. Because any one pixel has varying uncertainty, it’s recommended not to attribute specific pixel values to specific assets…especially over shorter periods of time. In other words, looking up the Number of Days Above 90 oF in 2040 for the pixel in which your home falls may not give you an accurate answer. Instead, look at the surrounding area and average over 2030-2050 for a less precise, but more accurate, projection.
Which Living Atlas climate data should I use?

Living Atlas now contains some amazing climate projection data contributed from many authoritative sources. Each is fit for specific purposes.
LOCA2 vs LOCA: we removed the older versions from Living Atlas. Please use these newer layers. Additionally, LOCA2 will soon be added to the Climate Mapping for Resilience and Adaptation portal.
LOCA2 vs CHELSA Bioclimates: LOCA2 was created specifically for community adaptation planning in the United States. So, if your analysis is focused on the US, we suggest using LOCA2 rather than CHELSA for resilience planning. For example, Days with Temperatures > 105oF are tailored for road construction. The variables in CHELSA were generated to support ecological modeling.
LOCA2 vs NCA5 Atlas: these are both derived from the same source data. LOCA2 uses combinations of shared socioeconomic pathways (SSPs) and time. NCA5 Atlas uses global warming levels. The former is better for understanding “how bad and when”; the latter is better for understanding local change relative to global change but has no explicit time component.
LOCA2 vs Global Wet Bulb Globe Temperatures (WBGT): These versions of LOCA2 do not contain heat thresholds that are more complex than just a simple temperature measure. If additional heat-health context is required for your analysis, integrate the WBGT layer into your planning. Like the NCA5 Atlas, WBGT uses global warming levels as the climate scenario.


Article Discussion: