 Southern California, although brimming with roads and people, includes mountainous areas that serve as sanctuaries for a surprisingly diverse array of wildlife.
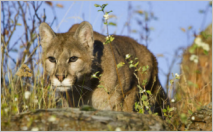
Among them are mountain lions — alternatively known as cougars and panthers — who risk life while stalking prey and mates amid the freeways that cross-cut their habitats.
The solution is man-made. According to KNBC in Los Angeles, property has already been purchased for a vegetated corridor spanning the always-busy US 101 Freeway northwest of the city. Overpass plans are ongoing. Construction is years away. When completed, the overpass will enable mountain lions to safely reach new hunting grounds and mates.
But is that proposed corridor the best one?
GIS users can decide for themselves because Learn ArcGIS has a new ArcGIS Pro lesson, Build A Model to Connect Mountain Lion Habitat. This lesson gives users the same opportunity as professional planners to conduct the analysis needed to save the mountain lions from possible extinction.
As part of the lesson, users will examine the mountain lion’s habitat, transform data into map layers, build a corridor model, and finally, evaluate the results.
By successfully identifying the most beneficial locations for corridors, users could help the mountain lions escape extinction by increasing their hunting and breeding opportunities.

These are some fantastic improvements to tables in ArcGIS Pro, really love the ability to freeze a column. Will there (or is there) any way to change the font for tables? I always like a monotype font for my tables. Thanks!
Hi Cody,
Thanks for the feedback, I’ll pass it along to the team. As for being able to change the font used in a table, there is an existing enhancement requesting this functionality. I would encourage you to contact support in order to be attached to ENH-000086470. This will provide you with notification when its status is updated. Thanks again!
JScholz,
If you refer to the documentation, can you then instruct the users how to display the raster field (don’t even talk about that in the documentation). So it’s not just important to say, but to say it right.
Hi Branislav,
Thanks for the feedback. I apologize that you found it unclear as written. To display the raster field you need to configure the Fields element. The Fields element controls the display of the fields for that layer. This is outlined in the table that details each element type. By checking on the display of the raster field, the image will then appear in the pop-up.