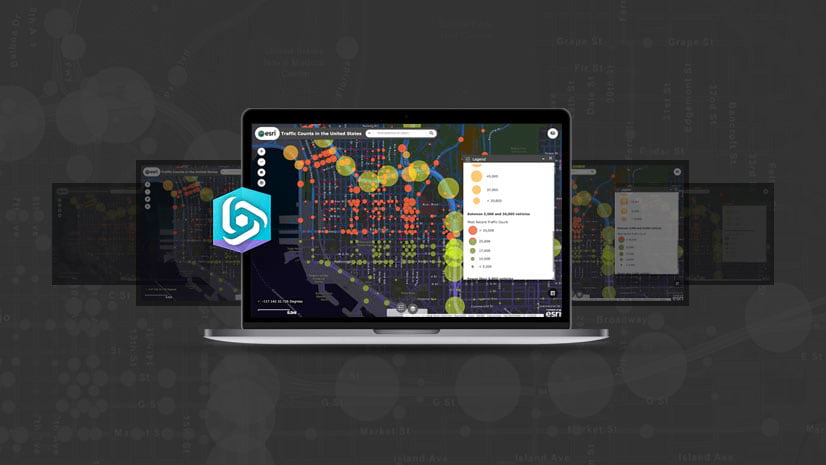
Building on a tremendous 2019 Dev Summit conference, we are proud to announce the release of versions 4.11 and 3.28 of the ArcGIS API for JavaScript. Version 4.11 is an impactful release, as it introduces an out-of-the-box editing experience with the new Editor widget, a new GeoJSON layer, client-side filtering, and more. Let’s dive into the highlights.
New Editor Widget
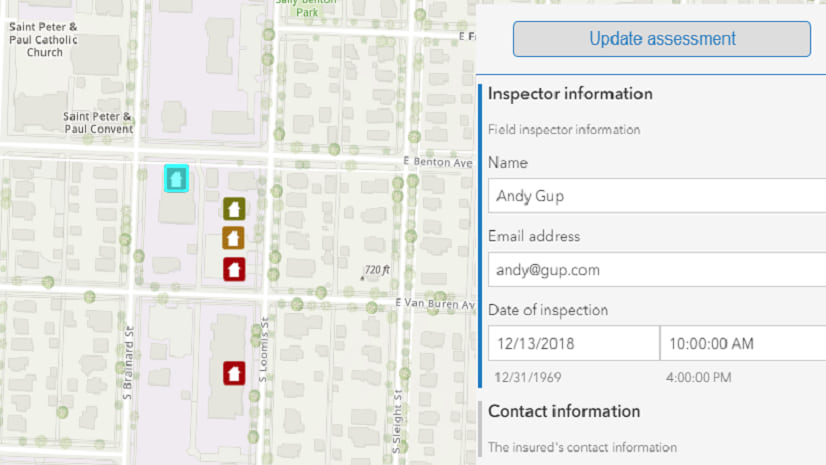
Version 4.11 introduces the much anticipated Editor widget. This new widget provides an out-of-the-box experience to help streamline the editing experience. The Editor widget allows you to either add new features, delete features, or update the geometry and/or attributes of existing features, within an editable feature layer.
The widget has several features that make it intuitive and easy to use. For example, it is automatically populated with controls to edit the feature layers within the map that are detected as editable (but you can also configure it to only work against a subset of them). Also, sometimes layers have many attributes that you don’t want the end user to have to deal with. In this case, you can limit the set of attributes to display within the widget to provide a simplified user experience.

Support for GeoJSON
With the new GeoJSONLayer, you can now work directly with GeoJSON client-side in both 2D and 3D. GeoJSON is a format for encoding a variety of geographic data structures. The GeoJSONLayer offers some of the same powerful capabilities as the FeatureLayer, for example: hardware-accelerated rendering with WebGL, data-driven visualization, client-side querying, filtering, and statistical calculations.

Drawing in 3D
One of the big additions for 3D is the capability to draw within a SceneView. One way to do this is by directly placing graphics with point, line, or polygon geometries onto the terrain as you have already been able to do in 2D. Additionally, there is a new transform tool that allows you to rotate, scale, and move 3D point symbols.
These capabilities are provided out-of-the-box using the Sketch widget in a SceneView. You can take this a step further by setting a 3D drawing symbol directly on the SketchViewModel (used by the widget under the hood). Then you can create specific workflows such as drawing extruded building footprints or points with volumetric point symbols.

glTF Support in 3D
Version 4.11 also adds support for glTF models, an open standard to represent 3D models. This means you can easily import your own 3D models or take advantage of large collections of 3D models available online, as shown in this sample. Because the glTF model is added as a symbol layer, you can use the previously mentioned transform tool to easily place them in a SceneView.

FeatureLayer Updates
There have also been many updates to FeatureLayer capabilities. For example, the FeatureLayer now has basic support for time-enabled queries. This enables the analysis of both client-side and server-side data with an optional temporal extent. Client-side filtering was also introduced for both 2D MapViews and 3D SceneViews. Only client-side features matching the filter conditions are displayed, and they can be filtered on attributes, geometry distance, and time.

FeatureEffects was added for 2D MapViews. This simple and powerful client-side functionality allows you to visually emphasize (or de-emphasize) features that meet a defined set of requirements. FeatureEffects result in a visual effect similar to filtering, but rather than removing features from the display, features outside your defined criteria can be visually muted (for example drawn with a gray color) to provide context alongside your emphasized features.
Dot Density Visualization Support
New at 4.11 is a dot density renderer for use with polygon layers. The DotDensityRenderer randomly draws dots to represent attributes within each polygon to help the user visualize the relative density of those attributes. The dot density support is similar to what is available with the 3.x version of the API, but with much faster performance.

Website Enhancements
Not only did the API get a major upgrade at 4.11, but we also invested some energy into the website. Another blog details these enhancements further. We welcome you to explore some of the recent improvements:
- A redesigned home page aimed at enabling you to either quickly jump into the SDK resource you are interested in or browse through some of the API’s capabilities
- A rich set of introductory API tutorials
- A better on-boarding experience and topic organization within the Guide pages
- A new section within the guide for learning about API core concepts
- An application showcase that highlights some of the API’s exciting capabilities (includes code for each of the apps)

Lastly, there are two significant enhancements to the Sandbox environment of the Sample Code. First, portal items and Esri modules are clickable, and link to their respective documentation or item page in ArcGIS Online. Second, local storage was enabled in the browser, in order to preserve changes made to samples in this environment.
Learn More
If you are looking for the full list of enhancements, updates and bug fixes, be sure to check out the release notes and new samples:
- Version 4.11 release notes and sample apps
- Version 3.28 what’s new


Commenting is not enabled for this article.