The newest release of ArcGIS Community Analyst has arrived just in time for the 2019 Esri User Conference! There are many updates arriving with this release, but we’ve compiled the key highlights below.
Updated 2019/2024 US Demographics Online Data
Every year, Esri’s Demographic Data Development team releases an annual update of US demographic data; this year is no exception.
Here are the demographic and data updates that are now in Community Analyst:
- 2019/2024 estimates and projections for US demographics.
- Consumer spending data now includes 2024 projections in addition to the latest 2019 estimates.
- 2019 Tapestry segmentation, daytime population, market potential, business locations, traffic counts, and crime indexes.
- 2013-2017 American Community Survey (ACS) demographics.
- New variables on life-stage and dependency that represent ratios of children and seniors to the working population.
- New variables on socioeconomic indicators to help explore the relationship between home value, income, wealth, and homeownership.
- Michael-Bauer Research data updates for 15+ countries and territories including Dominican Republic, Jamaica, Guatemala, and Puerto Rico.
Read more about all of the data updates in our What’s New in Esri Demographics (June 2019) blog.

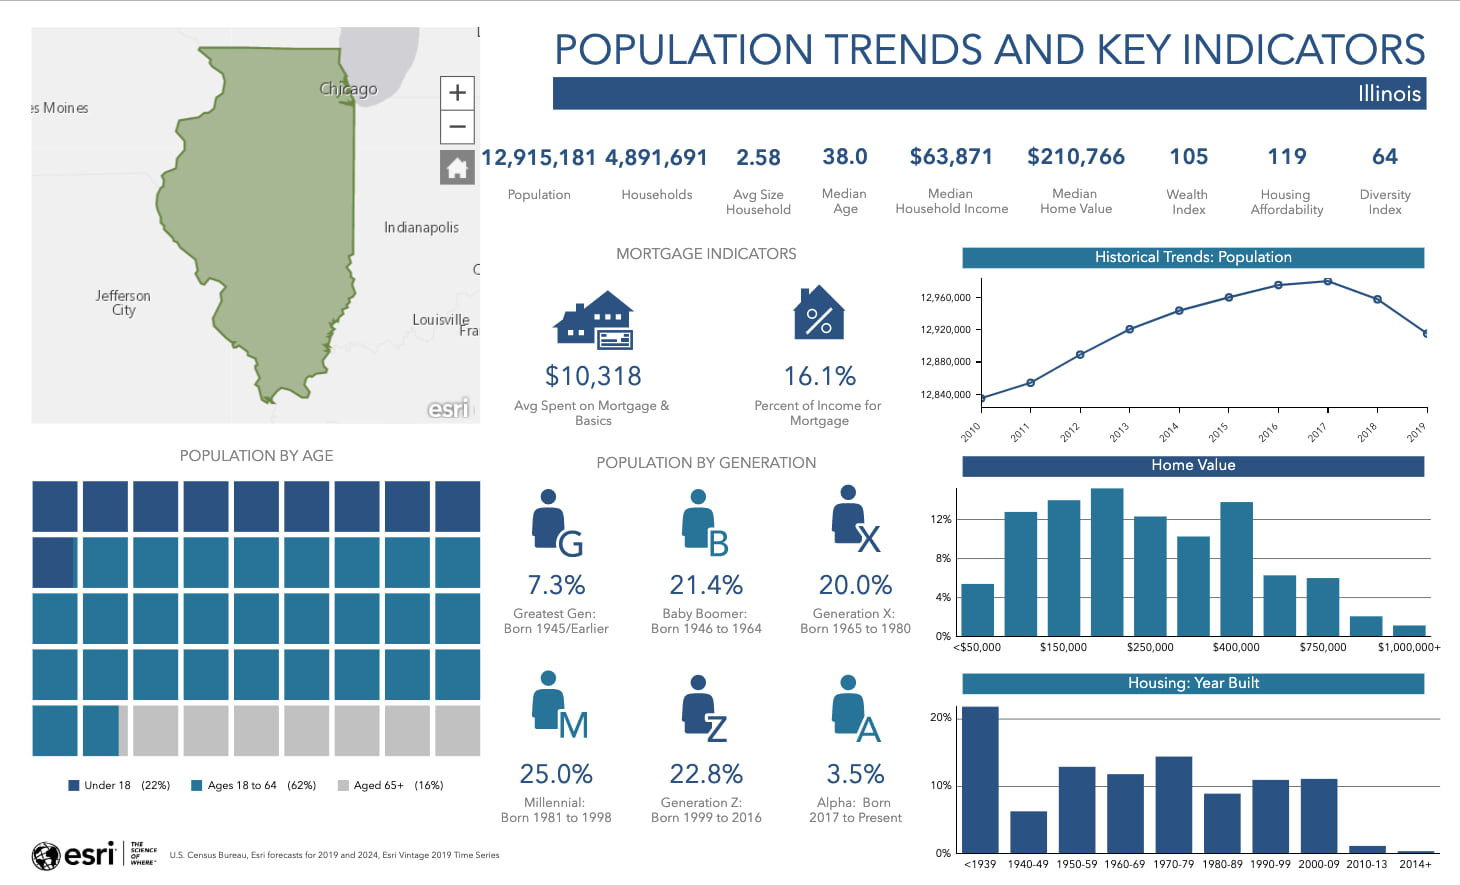
Use Historical Data
Many Community Analyst users have asked for the ability to use historical data in their workflows. We listened, and we’re excited to bring this feature to you.
Users can now access historical data for the US population, households, and housing units. With this, you can easily create infographics, charts, or maps to understand demographic trends in an area.
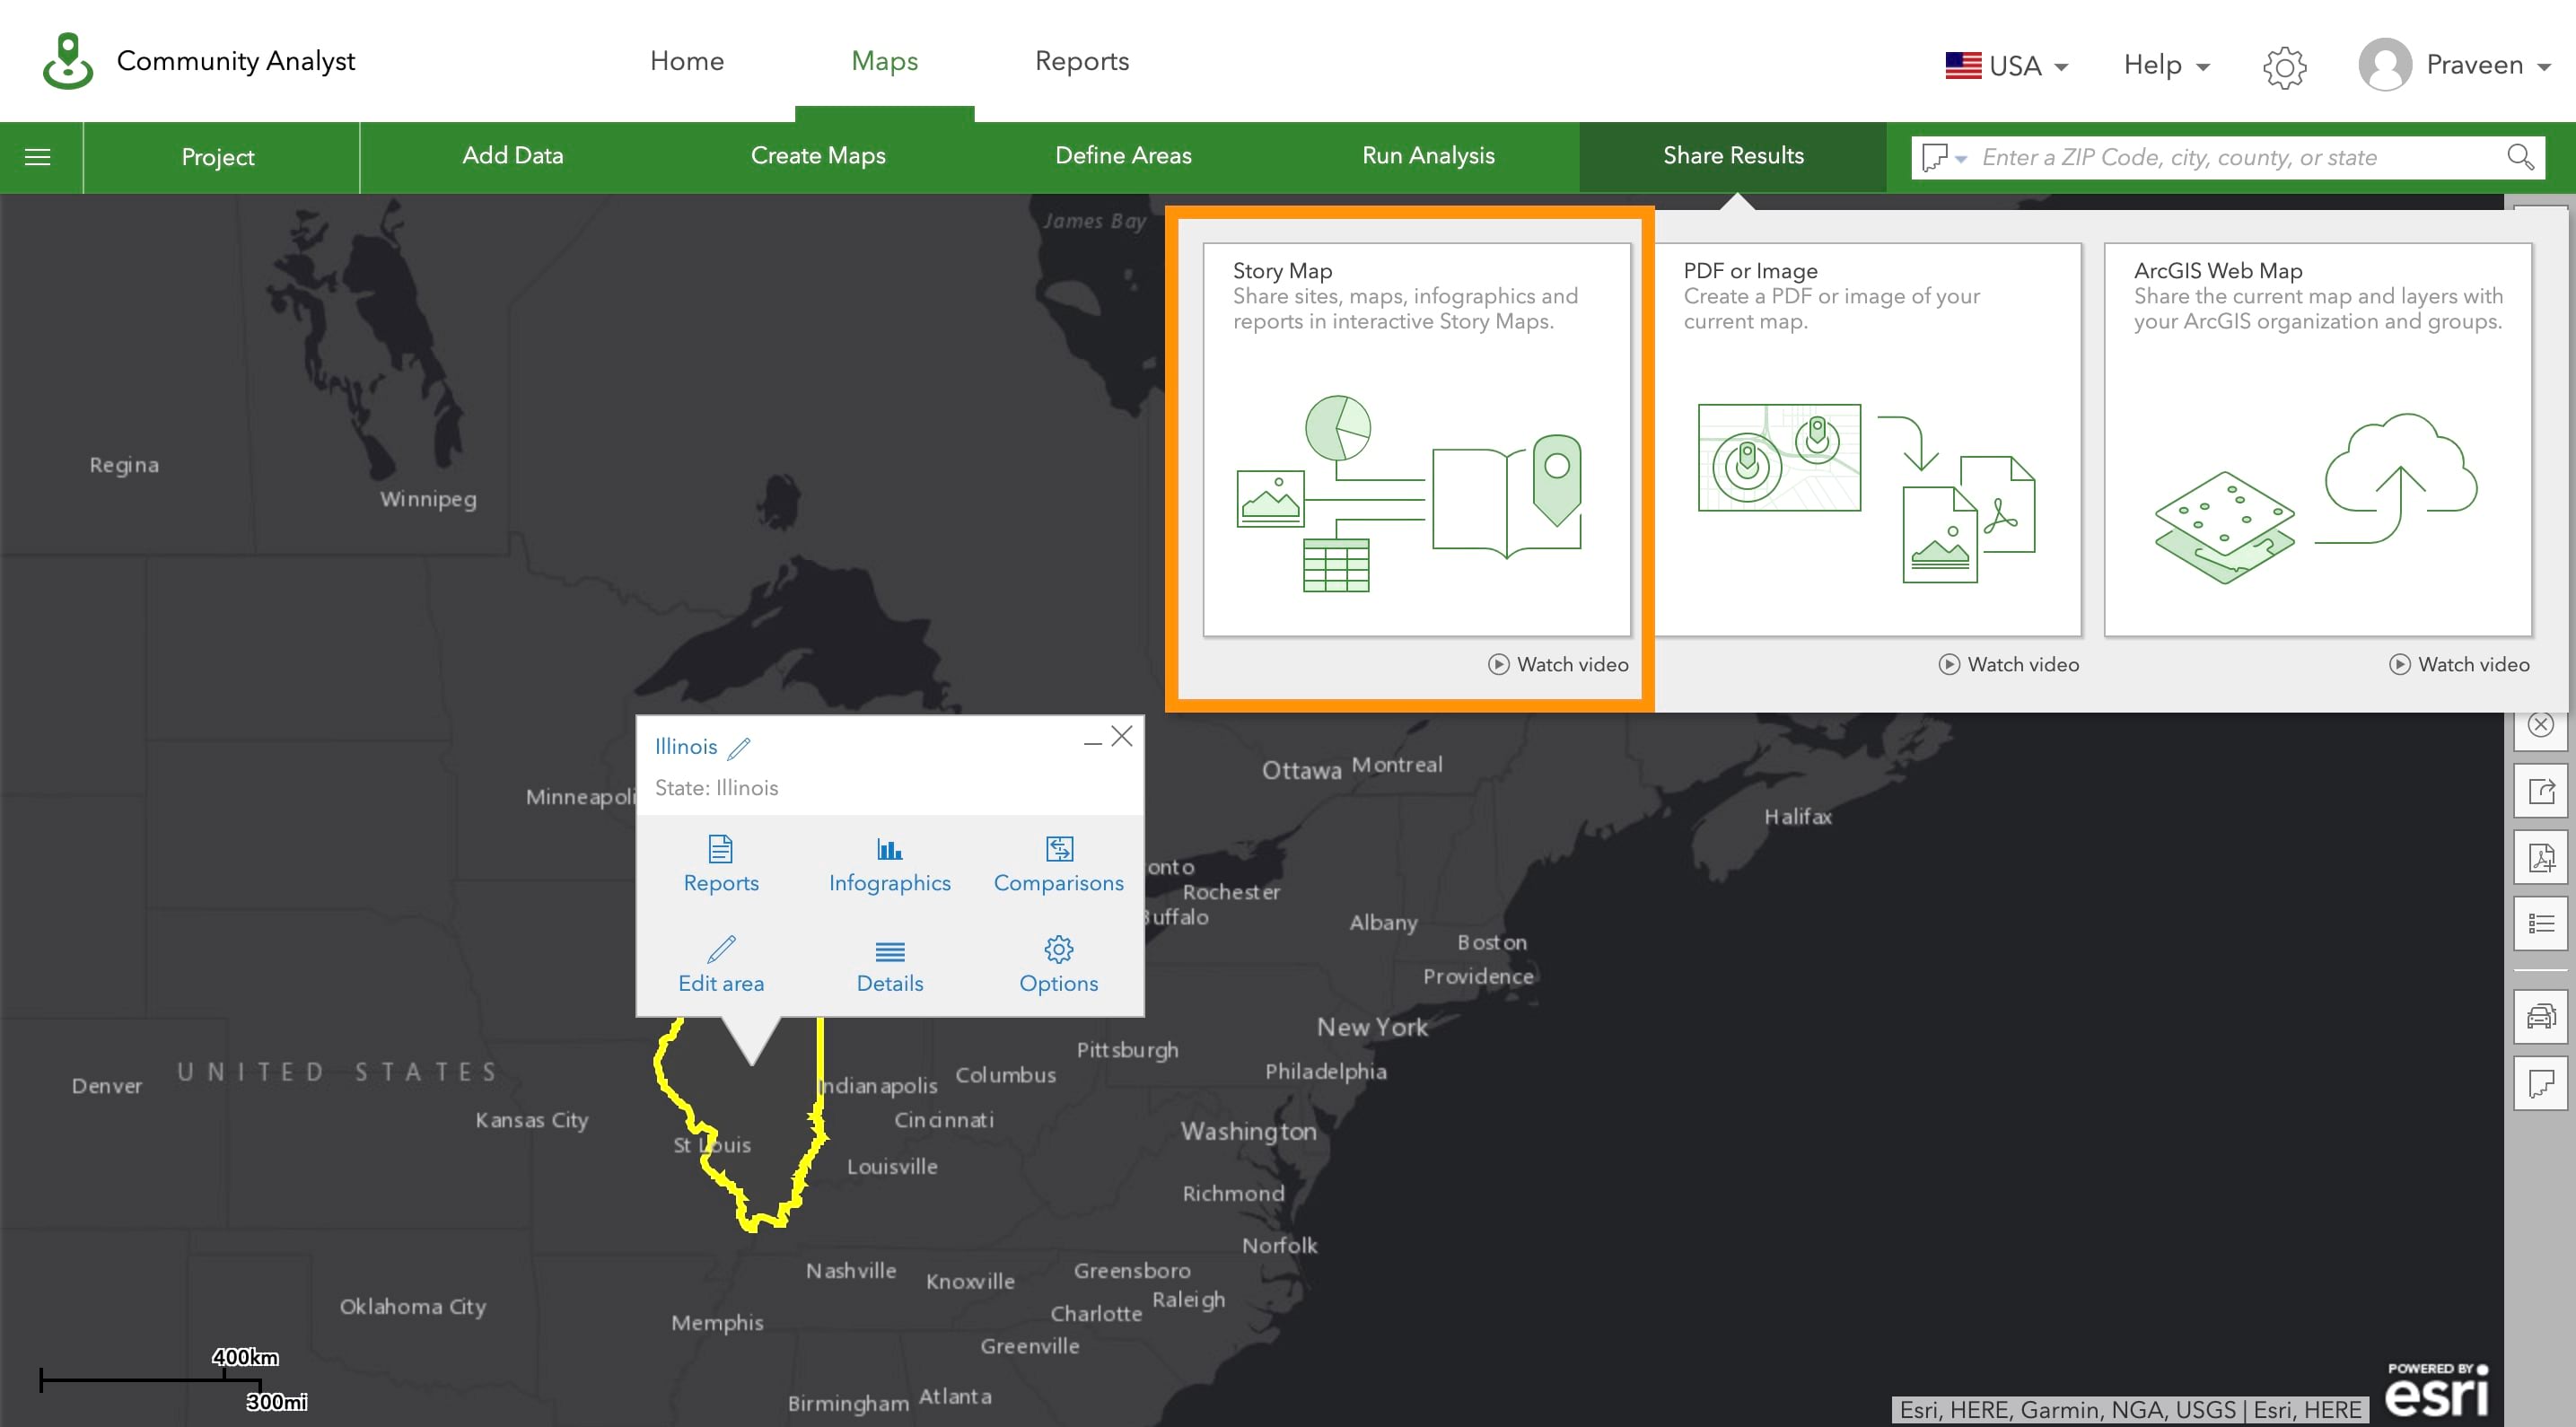
ArcGIS Community Analyst and Esri Story Maps
Ready for a brand new workflow? ArcGIS Community Analyst users can now add sites, maps, infographics, and reports in interactive Esri Story Maps in just a few clicks. Select one of the four starter Story Map templates, choose your sites, configure items for the sites (attributes, notes, infographics, reports, etc.), and watch as all of your selected content is added to a Story Map. You can further customize the story map using the Esri Story Maps building experience, too!
This workflow is a great way to share your beautiful, custom infographics and other Community Analyst content. With Esri Story Maps, there’s no better way to serve polished creative assets directly to the audiences that need them most.
Import and Map Geographic Boundaries
Let’s say you have a spreadsheet of Zip Codes or other standard geographies (e.g. counties, states) that you need to map showing the Zip Code boundaries. With the enhancement to the Import File workflow, you can now this.
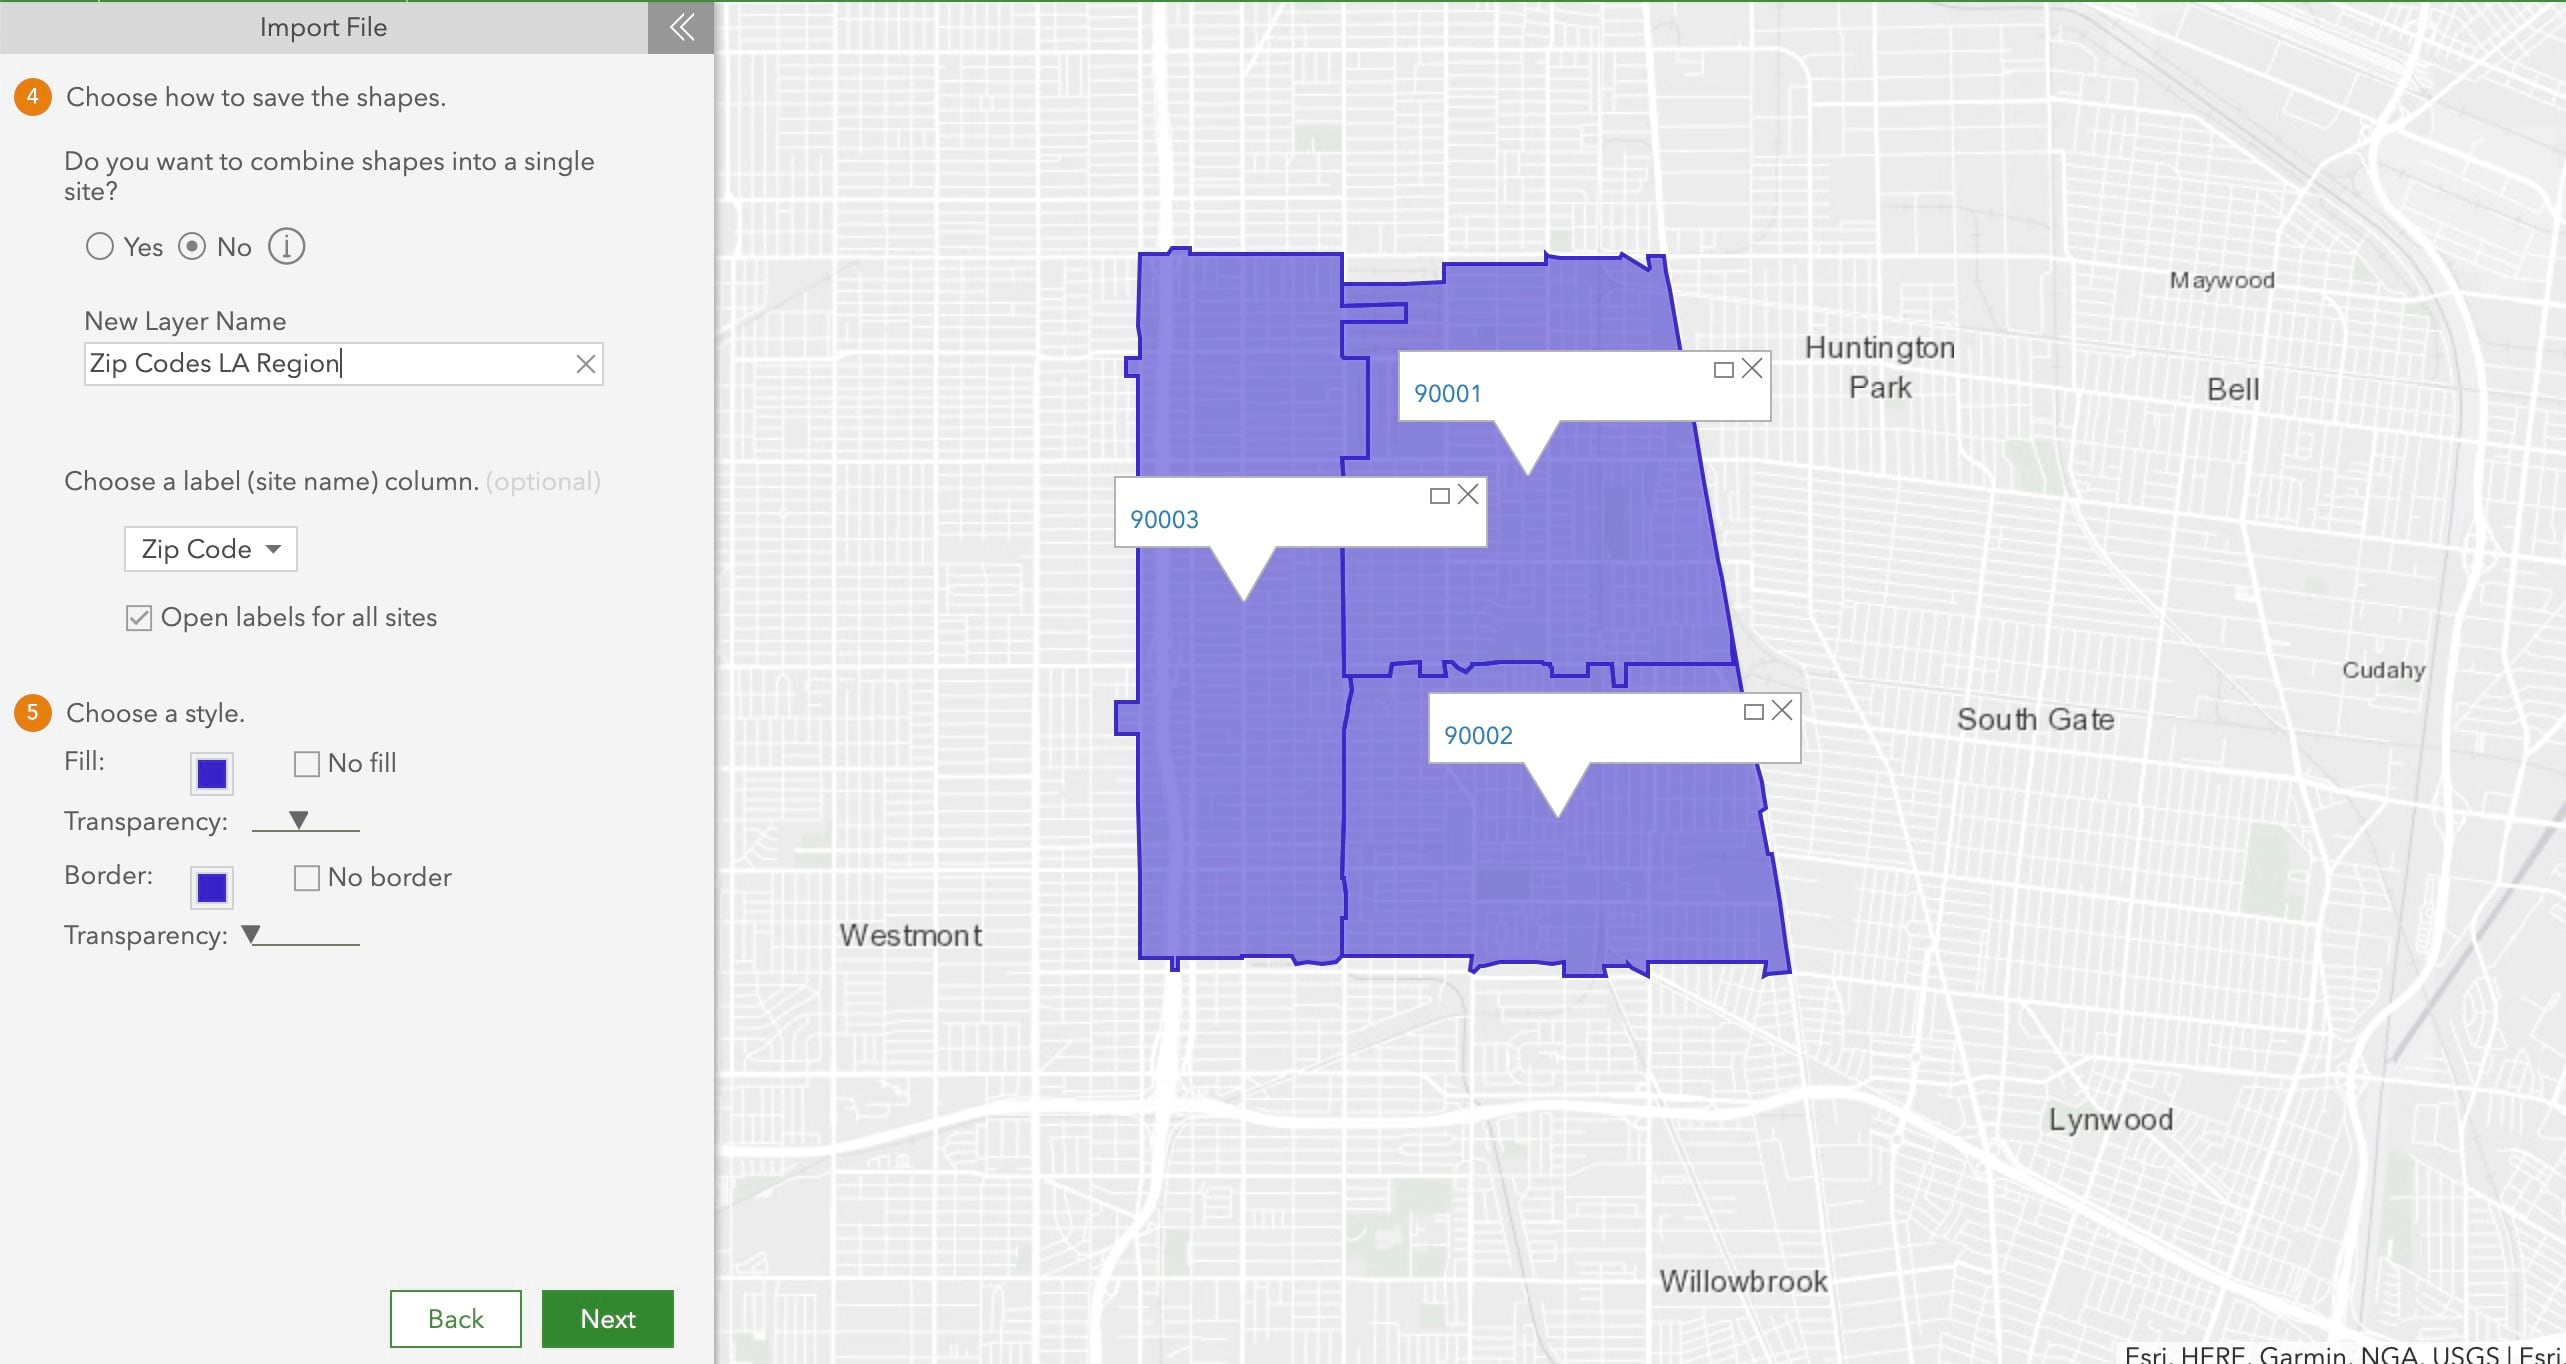
Simply select the Geographic Boundaries option when importing a spreadsheet, choose which column has the boundary information, and generate the map with geographic boundaries. You can save the geocoded result as a polygon layer or convert those to sites.
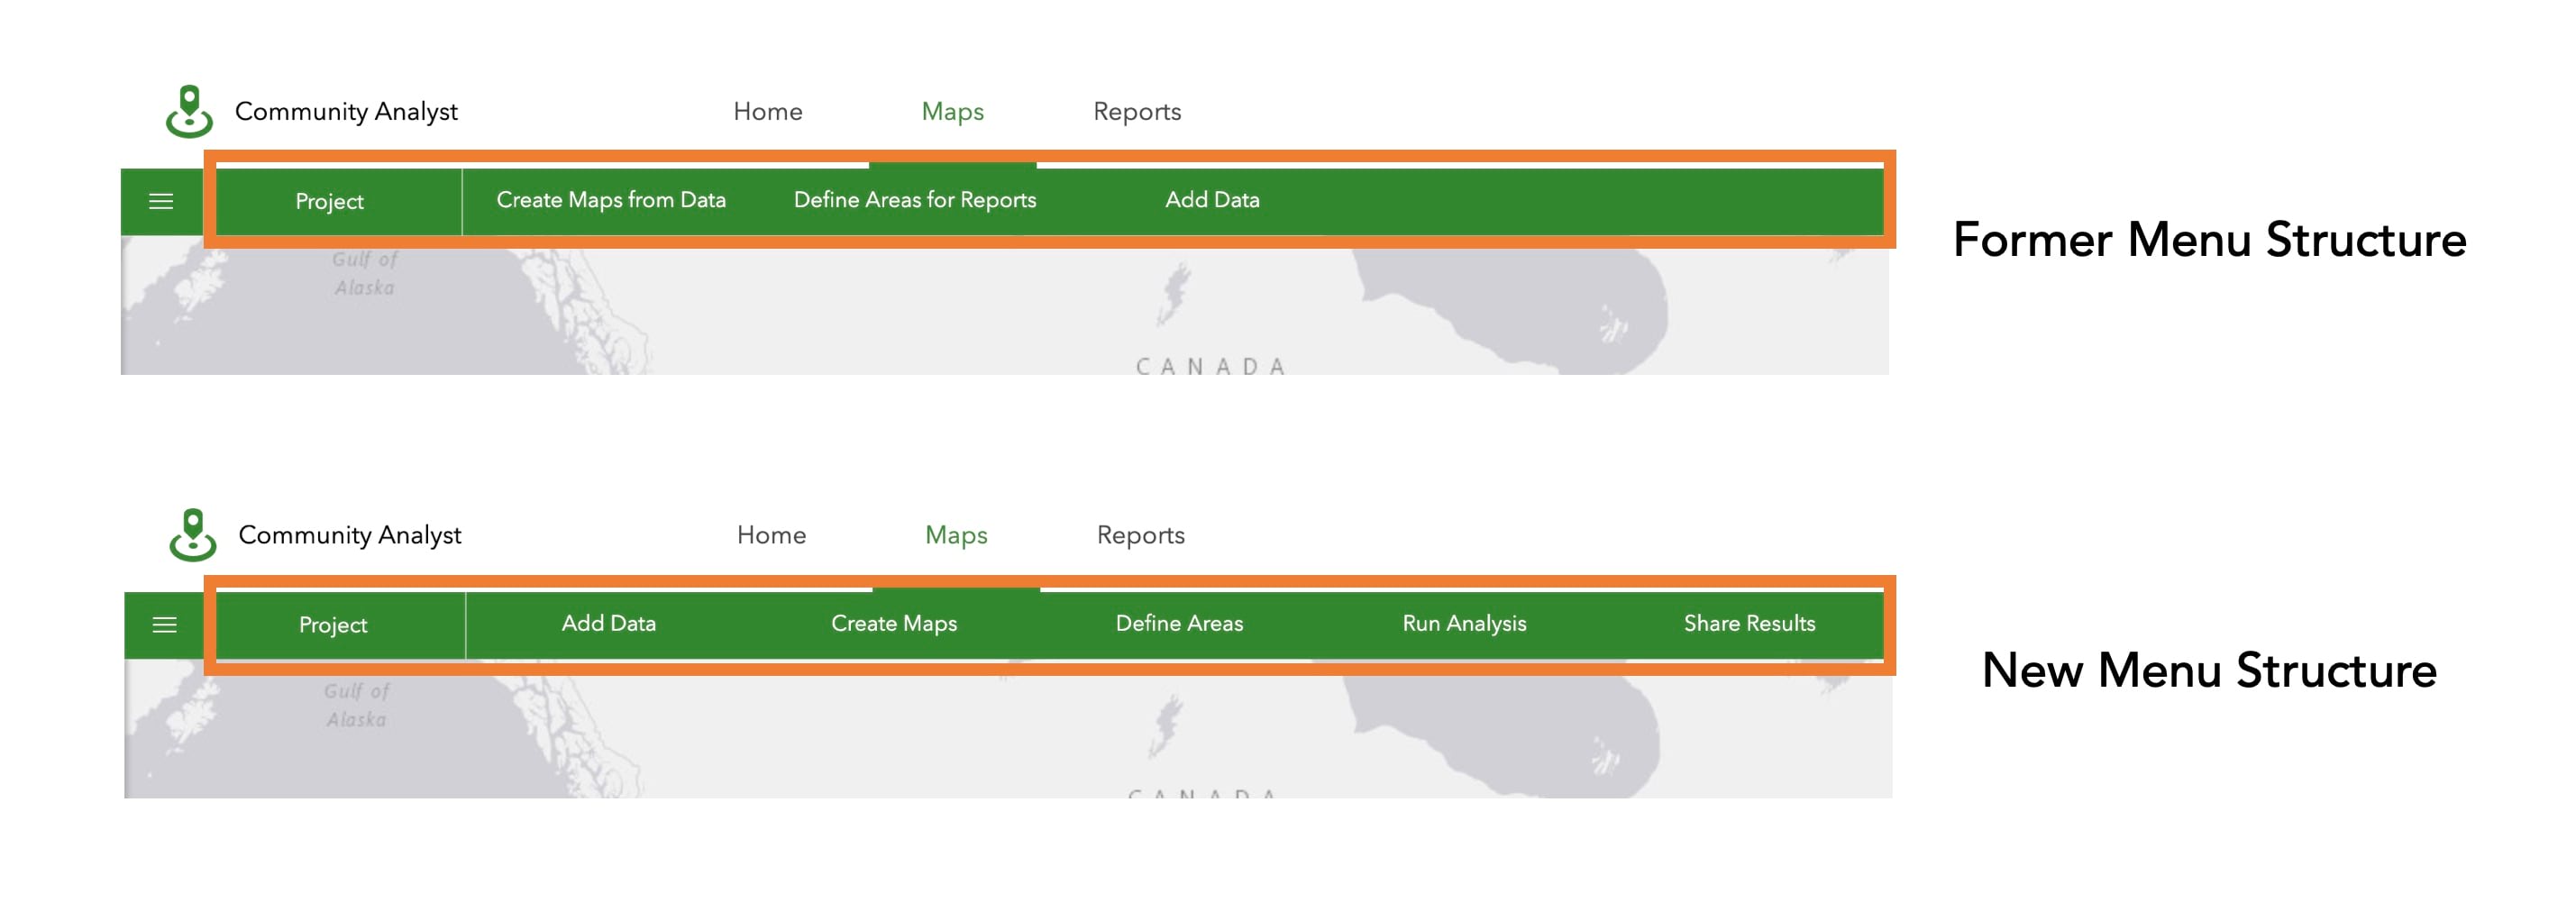
Improved Menu Structure
With this release, you’ll notice a brand new menu structure and renaming that’s bringing two new menus with it: Add Data, Create Maps, Define Areas, Run Analysis, and Share Results. We’ve organized common workflows to help you navigate to them quicker, and ordered them in the way they are used in your work.
Please note that none of the existing menus and their workflows will be removed.
For those that are very familiar with the existing structure, here’s how the tools have moved:
- The Suitability Analysis workflow will be moved under the new Run Analysis menu.
- Share Results is a brand new menu consisting of the new Story Maps workflow and the ability to share via PDF, image, and via ArcGIS Web Maps.
As ArcGIS Community Analyst continues to grow, adding and improving functionality along the way, we feel that these five menu topics will help to better organize, order, and house all of the tools and workflows.
We’re so happy to share this June 2019 release of ArcGIS Community Analyst with you. Below you can find some links for Community Analyst that you may find useful.
- Community Analyst Website
- Community Analyst login page
- Esri global data overview
- Esri U.S. data overview
- Community Analyst help and documentation pages
- GeoNet Community


Commenting is not enabled for this article.