Applying Racial Equity to COVID-19
In our previous blog post, we gave context to racial inequality and its impact on the COVID-19 pandemic. In general, preliminary COVID-19 case data reveals inequities between racial groups. This inequity is a result of entrenched systemic inequality. Therefore, organizations must urgently respond with racially equitable crisis relief. To that end, a racially equitable response to COVID-19 means providing proportionately more resources to communities of color. To emphasize, these communities are unserved and underserved. Therefore, they lack the resources needed to withstand and recover from a crisis. Here, we will address how to analyze your community to understand where underserved populations reside.
Before we act, we must understand the content and context of racial marginalization and its impacts. Without racial data, we cannot understand racial inequity.

Accessing Data for Your Analysis of Racial Inequity
The Living Atlas of the World contains data layers with information about various demographic characteristics. Race, ancestry, language, income, age, education, and employment data exist in the Living Atlas, to highlight a few. Each data layer contains data at the state, county, and tract geography levels. These different levels enable you to analyze inequity at national, state, or local levels. You can easily add these data layers into your maps and applications using ArcGIS Online or ArcGIS Pro. By combining these layers, you can learn more about the communities in need in your area.
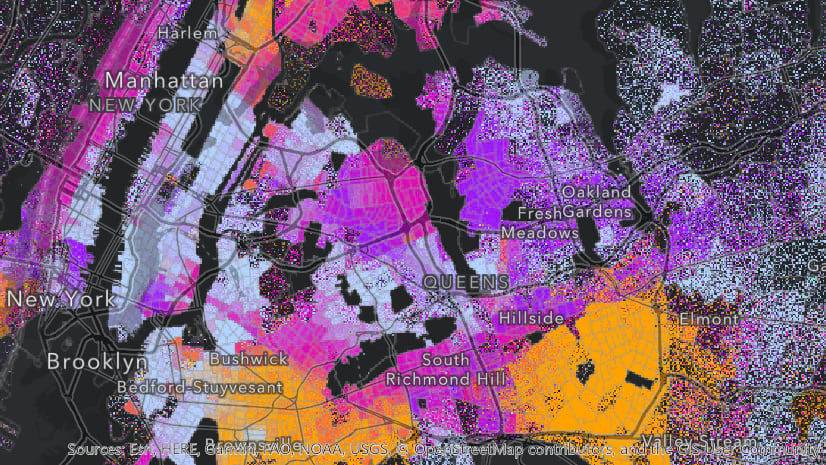
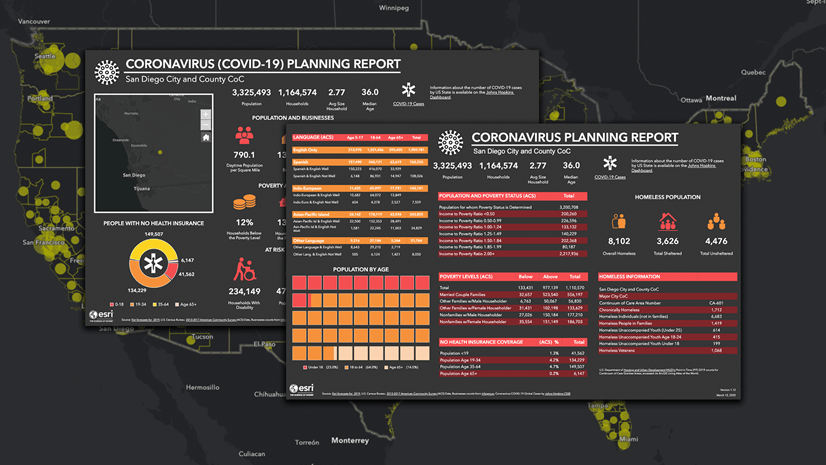
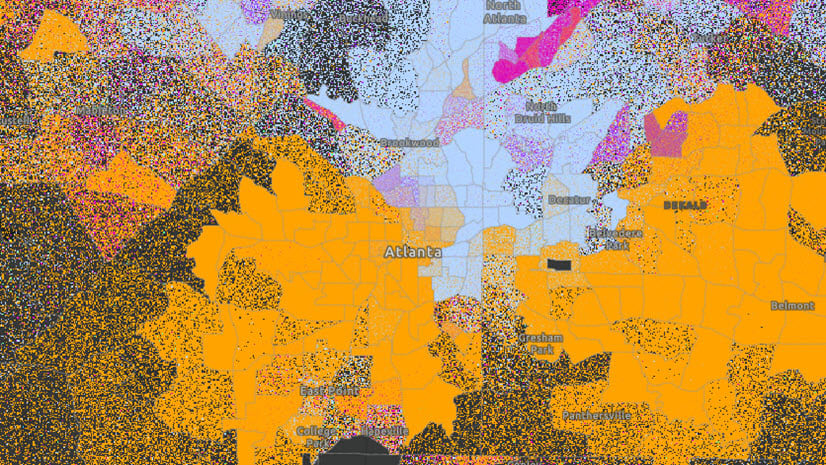
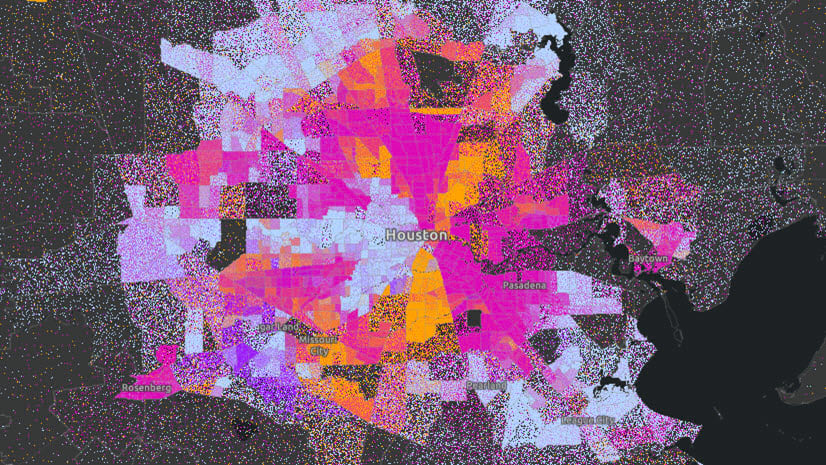
Esri released an easy-to-use web application to look at COVID-19 vulnerability concerning people experiencing homelessness. This blog walks you through exploring the data available in the web application. Use the web application in addition to Living Atlas datasets to help you identify vulnerable populations in your community. By doing so, you can equitably target your outreach and response to COVID-19.
It will also be essential to bring your data into your analysis as you look for racial inequities. By adding your data, you can identify racial inequities in your current investment of resources for COVID-19 recovery. There are many ways that you can bring your data into your racial equity analysis. This Story Map walks through some ways to add data.
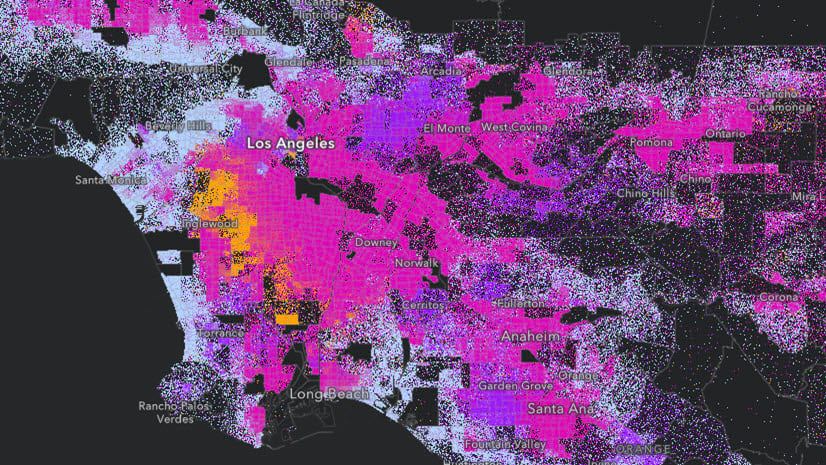
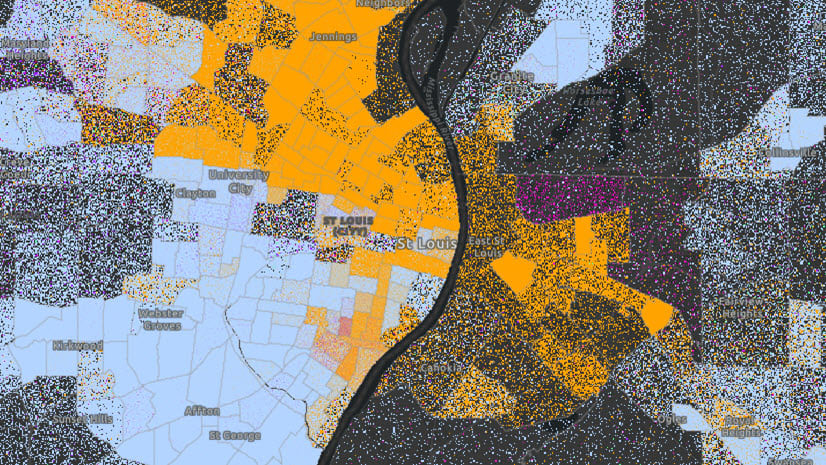
The gallery below includes just a few examples of content in the Living Atlas that can help you understand current racial inequities.
Considerations for Your Racial Equity Analysis
A racial equity analysis might begin with mapping where members of systemically disadvantaged communities reside. Then, you may assess whether those communities can readily access needed resources. To clarify, some of these resources include healthcare, virus testing, food, broadband, or other critical support needed amid COVID-19. Therefore, you likely have already set up emergency resources in your community. For example, you may have deployed food distribution at schools, pop-up health clinics, or testing sites. If so, assess whether these disproportionately burdened communities have equitable access to those resources.
Below is a list of some COVID-19 racial, health, and economic equity risk factors. For the most significant impact, we recommend combining these to identify those populations most acutely at risk among your constituencies:
- Areas with higher populations of people of color
- Percent of residents in a geographic area experiencing multidimensional health risks (food insecurity, poverty, senior population, population with a physical disability)
- Lack of health and economic resources such as food and banking deserts
- Percent of people in an area working in industries that are at higher risk for wage loss
- Percentage of homes without broadband internet access
- Unbanked and underbanked households in vulnerable populations
Breaking Down the Data
When analyzing for racial equity, break down your data by race, ethnicity, gender, language, and other demographic factors as much as possible. As a result, you can better detect inequities and informative patterns. Given such information, an equitable response devotes resources in proportion to vulnerability and need. Notably, vulnerable communities often include individuals who are at the intersection of multiple disadvantages.
Your efforts should provide a greater focus on communities at the intersection of numerous risk factors. Therefore, the CDC’s Social Vulnerability Index application is a great tool. You may also consider mapping this index alongside demographic characteristics such as age or race. To learn more, here is a blog explaining how to create this analysis.

Analyzing for Action
There are many ways you might analyze data spatially to determine where needs are greatest in your community. For example, you might create a Walk Time Map. A walk time map helps us understand, for example, where a significant number of Households with No Vehicle Available and Children Eligible for Free or Reduced-Price Lunch in Communities of Color might need access to a food pantry or school food distribution site. Families of color are less likely to have personal or family wealth to rely on in a crisis. This inequity is due to the Racial Wealth Gap resulting from centuries of institutional discrimination. Therefore, children in communities of color may be at an increased risk of food or housing insecurity during this crisis. Immigrant populations may also be at higher risk of exposure. Additionally, undocumented immigrants may lack access to social safety net programs that can provide financial protection.

It is critical to anticipate these needs proactively and plan resource allocation accordingly. For example, you can use data to anticipate the needs of the uninsured. To do so, start by mapping where food and healthcare resources exist in relation to people without health insurance.

Addressing Data Gaps
You may lack data on specific populations you suspect may be at risk. If so, consider setting up automated systems to begin to collect the data you need. There are several GIS tools you can use to collect data on racial inequity during COVID-19. For example, Esri’s free Coronavirus Response Solution template includes survey templates and data collection tools. Configure these tools to capture the data you need to better understand and serve the most vulnerable in your community.

We want to hear from you
How is your organization responding equitably? Please share your success, tips, and challenges by commenting here. You can also share your experience and questions using the GIS for Equity and Social Justice GeoNet Forum.


Article Discussion: