Kristian Ekenes
Connect:

Kristian is a Principal Product Engineer at Esri specializing in data visualization. He works on the ArcGIS Maps SDK for JavaScript, ArcGIS Arcade, and Map Viewer in ArcGIS Online. His goal is to help developers be successful, efficient, and confident in building web applications with the JavaScript Maps SDK, especially when it comes to visualizing data. Prior to joining Esri, he worked as a GIS Specialist for an environmental consulting company. He enjoys cartography, GIS analysis, and building GIS applications for genealogy.
Posts by this author
Animate and explore COVID-19 data through time

Combine the ArcGIS JS API's fast rendering capabilities with the TimeSlider to allow your users to animate and explore COVID-19 data through time

Continue Reading

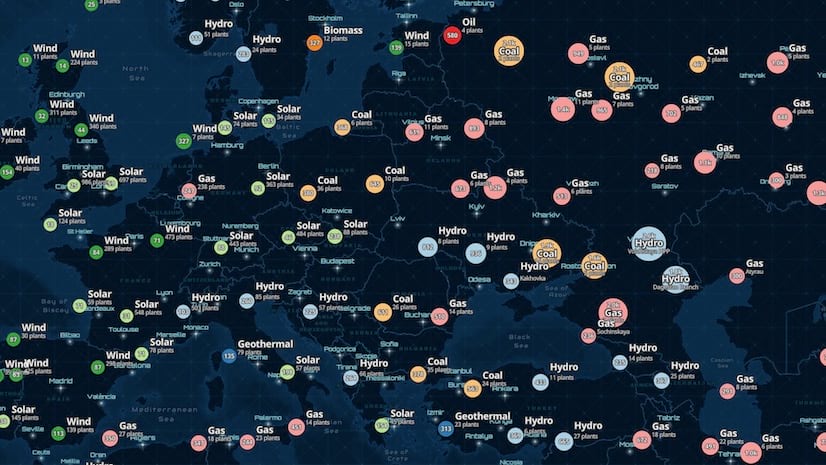
Labeling support added to point clustering

The ArcGIS API for JavaScript added support for labeling point clusters with the total count or other aggregate summary information.

Continue Reading

Capacity Analysis: a custom web mapping solution for understanding the impact of social distancing

Capacity Analysis is a new app demonstrating why custom web apps can be better solutions that generic web mapping software like ArcGIS Online.

Continue Reading

Mapping large datasets on the web

Mapping large amounts of data on the web has always been a challenge. Learn techniques you can use to improve performance with large datasets.

Continue Reading

Auto size by scale now available in Map Viewer Beta

The Map Viewer Beta allows you to automatically change the size of point and line symbols by scale for all styles.

Continue Reading

How and why to adjust symbol size by scale in web maps

Though subtle, icon and outline sizes varied by scale will turn a mediocre visualization into a great one.

Continue Reading

Better colors for better mapping

The Esri color ramps and Visualization Best Practices guide pages assist you in creating better maps using better combinations of colors.

Continue Reading

Point clustering now available in ArcGIS JavaScript 4.x API

Clustering allows you to summarize and explore point layers as spatial clusters.

Continue Reading

Make your histogram legendary

Add additional meaning and context to your data-driven map using a colored histogram instead of a legend.

Continue Reading

1 2 3 4 5 6 9