The 3DFx widget in Web AppBuilder is designed to help you easily create impressive animated 3D web apps. Earlier this June, we included some exciting improvements to the 3DFx widget. Now, we are adding a total of five visualization types in the 3DFx widget.
The typical comments on 3DFx apps are that “Wow, this is so cool!”. For those of you who had a chance to play with the 3DFx widget, you may have already found that unlike other visualization related widgets of which the main purpose is to enable the spatial reasoning for users, the 3DFx widget uses 3D effects to capture the user’s attention through compelling representation of data.
In this post, we will illustrate two types of the 3D visualization supported by the 3DFx widget. This example is inspired by an interactive map which explores Queen Elizabeth II’s overseas visits.
Queen Elizabeth II has visited 128 countries
It is said that Queen Elizabeth II has traveled, without a passport, 1.1 million miles around the world, all through 272 trips and visiting 128 countries. The animated app below, which is created within a few minutes, shows all her trips .
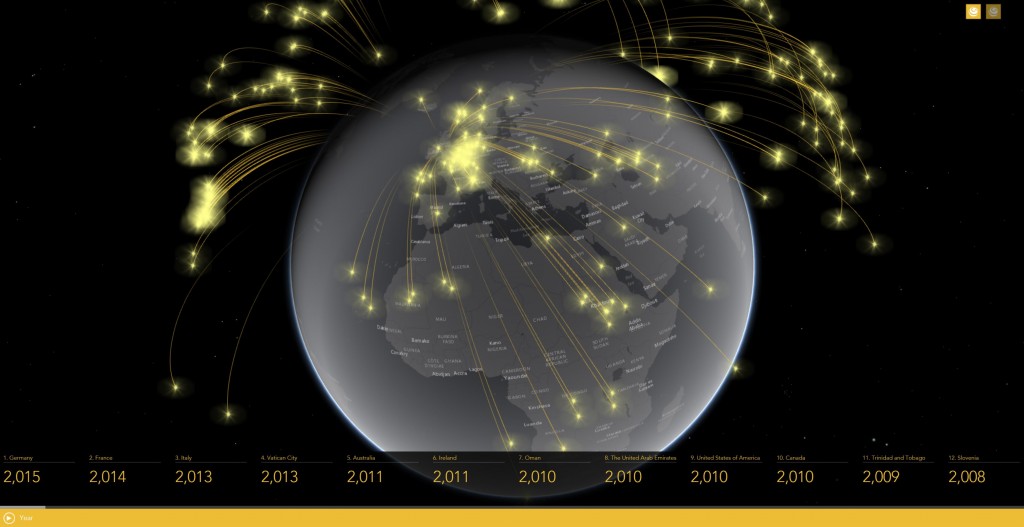
Click the image above to see a live demo!
In this app, each flying glowing ball represents one trip. When the app finishes loading, each ball will jump from London to one of the countries she visited. The size of the ball can be controlled through numerical attributes in your underlying data. In this example, the selected numerical attribute is the year during which a trip had occurred. This particular visualization type is called the Jet Trail. The color of the 3DFx visualization is based on the selected Web AppBuilder theme color. At the bottom of the screen, you can see the name of the destination country and the year of each trip. For example, the first record is her trip to Germany in 2015.
In the upper right corner, you will notice there are two 3DFx widgets. When the app loads, the 3DFx widget with the Jet Trail visualization will automatically become active. You can click the other 3DFx widget to see the Fireball visualization. See the image as shown below.
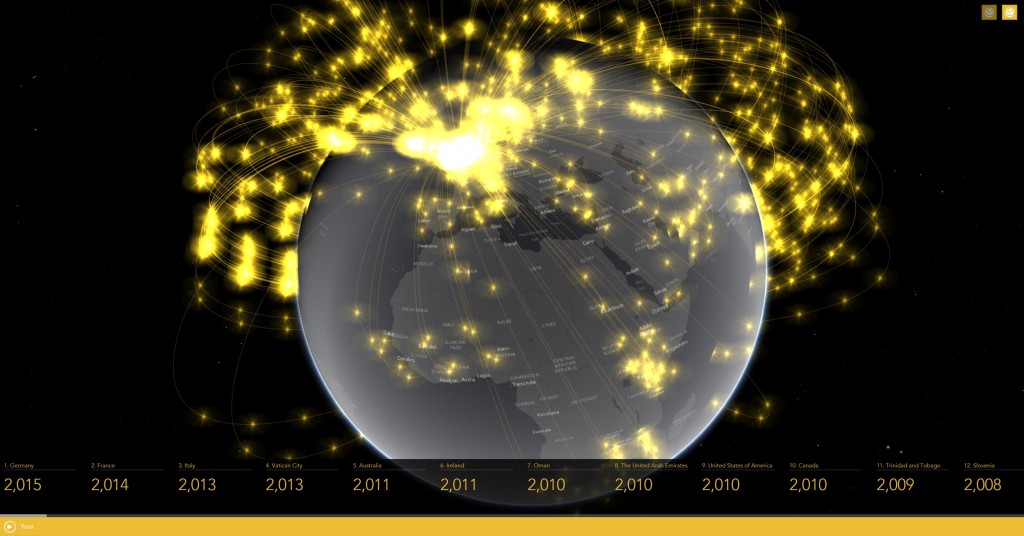
As splendid as the Jet Trail, the Fireball visualization type uses arcs connecting London to other countries where the queen has visited. Glowing balls are flying along the arc.
Both the Jet Trail and the Fireball require the Origin and Destination (OD) data (published as a polyline feature service). Each OD pair needs to be set as the start and end of one polyline. Currently Web AppBuilder for ArcGIS, only supports less than 2000 pairs of OD data in your polyline feature services.
We hope you like this app. More examples are coming to demonstrate the capabilities of the 3DFx widget. Stay tuned.
Summary
GIS users always have exciting stories to tell. To begin the story telling, you may only have 2 seconds to grab the attention of your audience. The 3DFx widget is designed to help putting an exciting cover to a story. Sometimes, you can tell a lot about a book by its cover.
Article Discussion: