We are pleased to announce the release of Web AppBuilder for ArcGIS Developer Edition v2.0 Beta. You can now bring 3D into your own web apps! Get it from the Esri Early Adopter Community Web Site.
Over the past few days we’ve spent some time putting together a scenario that illustrates some of cool things you can do.
The Waterfront Project
We’ve created the Waterfront Planning Viewer sample to illustrate how a City Planning Department could take advantage of 3D visualization to communicate a new urban development project in a compelling way. 3D really makes a difference because traditional 2D maps may not always convey the vision of the new development scenarios as effectively.
Please note that while this is a completely fictional example, it is something that YOU can do with your existing GIS data and Web AppBuilder for ArcGIS.
The opening – Start by opening the app:
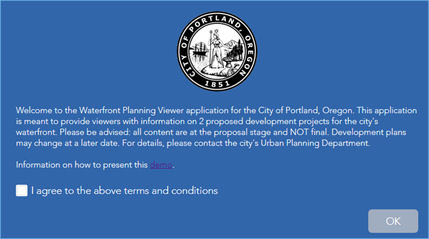
Giving people context for what they are about to see, is always a good idea. As you start the web app, you will see a splash screen. We built it with the Splash Screen widget in Web AppBuilder. Note that we put some effort into describing the project. The splash screen is important for making acknowledgements and if necessary, show a disclaimer. Do not take this for granted as acknowledgements and disclaimers are sometimes mandatory. The splash screen is also a great place to brand your app with your organization’s logo and corporate colors. This is not just for appearances, but can actually also make the app more authoritative.
First impressions:
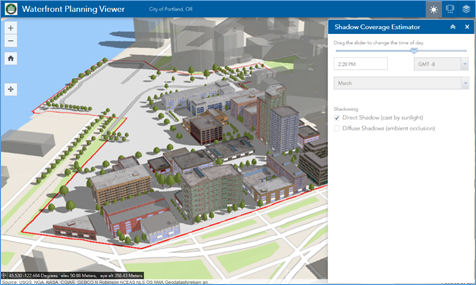
You are presented with a view of the city featuring one of the new development plans (Scenario B). Take your time to fly around the scene and familiarize yourself with the project vision.
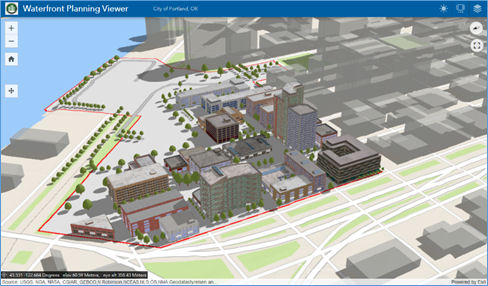
The web scene displayed in the app shows the City of Portland, OR waterfront with one of the proposed development scenarios (B), which represents a proposal of mixed-use buildings.
As you would for your 2D maps, we carefully chose how to represent information: proposed buildings are rendered in full color, symbolized with façade details – this is meant to show how these would look (if built) in context of the landscape and provides viewers a visual and realistic sense of how the new development would affect the waterfront. Surrounding buildings that are not part of development scenario B are shown in grey and rendered with simple schematic symbology, because they are part of the background – meant to give some context, but they are not the focus of the app.
Selecting what to represent schematically or with true models is an important decision. Not just to ensure visibility, but also to speed up the loading time of the application. Some help topics to help you get started:
Please refer to the whitepaper on Publishing Hosted 3D Layers for more information on what data can be published to ArcGIS Online and what data may be published on-premises to Portal for ArcGIS.
Examining different scenarios:
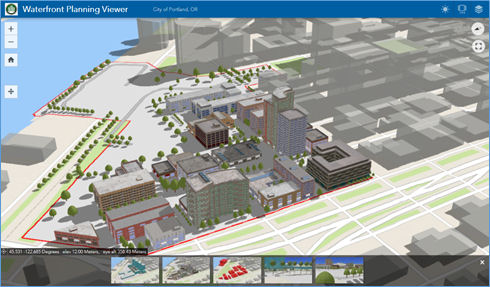
Next, we are going to look at Scenario A, which shows a convention center near the waterfront and 4 condominium buildings. In the upper right corner, when activated, the Slides widget will display a ribbon at the bottom of the app. Think of these conceptually like spatial bookmarks for the web scene. In addition, as you click each slide, notice that the content displayed changes. For example, different layers in the web scene are rendered, the view perspective changes, etc. Each slide provides a custom view of the web scene which can be used for presentations and convey a story. This widget helps tell a narrative for the waterfront planning project.
 Take your time to explore each slide.
For your own apps, you will want to carefully select the observer’s point of view and layers in the web scene to be displayed. Make sure you also give each slide a representative title.
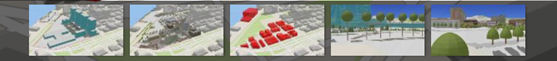
The 5 slides in this web scene include:
- Scenario A → shows the proposed buildings in realistic detail;
- Scenario B → shows the proposed buildings in realistic detail;
- Proposed demolition → shows old buildings rendered with simple schematic symbology;
- Riverwalk scenario A → a different view aspect of the web scene, close up of 3D trees;
- Riverwalk scenario B → a different view aspect of the web scene, close up of 3D trees.
Beyond slides:
The slides are the means by which most people will navigate your web scene, but you can choose to give users more control. In the upper right corner, the Layer list widget enables you to view the different data layers in the web scene.
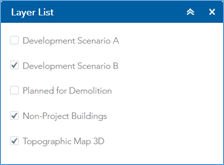 You can switch between the different development scenarios A and B, buildings that are planned for demolition, surrounding non-project buildings, and the topographic 3D map.
Web AppBuilder offers many widgets and that is a great thing, but don’t be tempted to add too many as to be counterproductive to the app’s user experience.
Shadows:
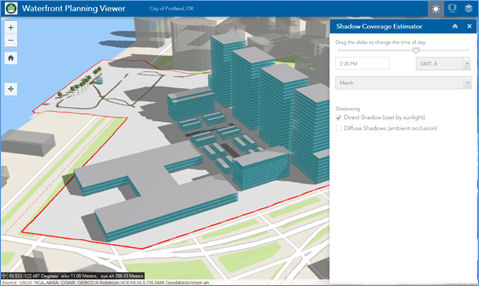
In addition to 3D visualization, this app also has some analysis functionality. In the upper right corner, the Shadow Coverage Estimator tool enables you to visualize the amount of shadow coverage that each new proposed building would project onto the surrounding ground area, for different times of day and year. With one of the development scenarios A or B rendered in the display, you can use the Shadow Coverage Estimator tool to compare how the 2 different development scenarios would affect access to sunlight along the waterfront. End users can dynamically contrast the impact of the 2 development scenarios visually within the app and view the comparison from many different viewpoints. This could be helpful for estimating real estate values of different locations in the buildings, planning events, etc. This functionality was enabled using the Environment widget.
This is just an example of the type of things you can do. Now it’s your turn: download Web AppBuilder for ArcGIS Developer Edition v2.0 Beta and share your feedback on the Esri Early Adopter site.
Sincerely,
The Web AppBuilder for ArcGIS Dev team

Article Discussion: