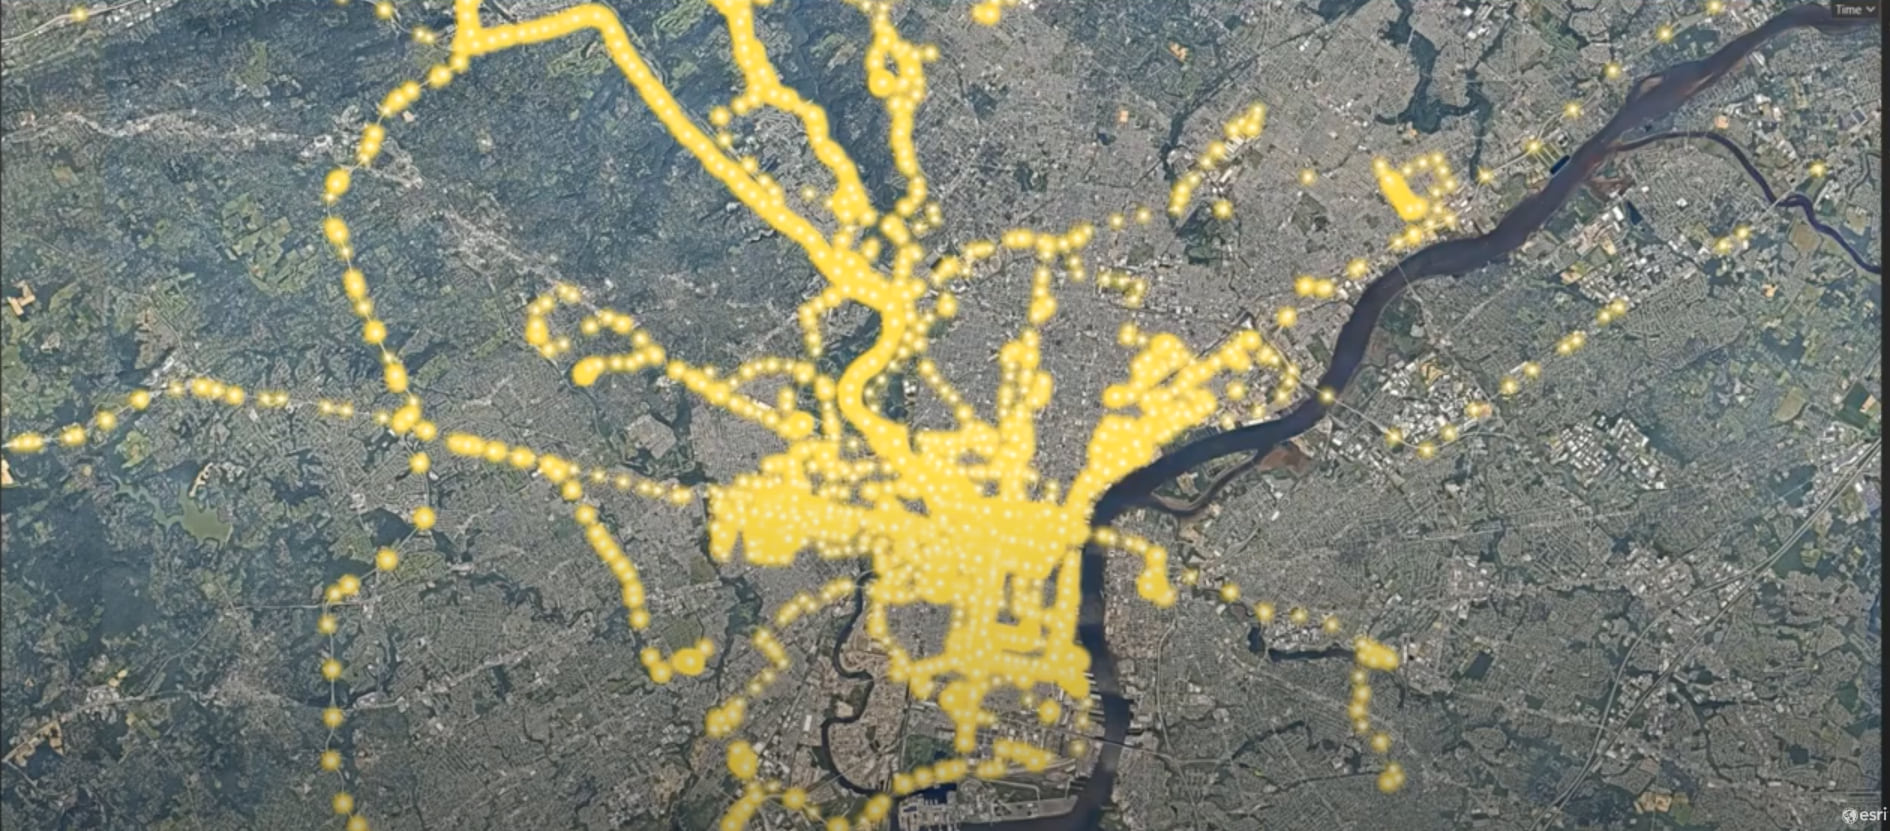
You might be asking yourself, “What exactly is movement data?” You’re likely familiar with the more common examples like GPS, tracking data on packages, or even mobile marketing data that pushes insights to individuals based upon their individual movements and the likely encounters along that path. Movement data is typically collected in high volumes with the only information required for collection being a unique track ID, location, time stamp and without context, can look like just a whole bunch of dots. The movement tools within ArcGIS AllSource enables you make sense of what would initially appear to be a giant mess. The movement analysis toolset allows you to analyze point track data, including comparing tracks over different areas, extracting unique identifiers from a point track dataset, and identifying where tracks meet.
Connecting the Dots
The yellow dots in the picture above show movement data on a map within ArcGIS AllSource. To make sense of these dots, different classifications of movement events can be categorized. The point track data contains location and time information that indicates if the device is moving. From this data we can see if a device is turning, stopping, and/or accelerating. This allows you to answer questions i.e.: “How fast was it going?”, “Where did it stop?”, and “Where did it turn around?” It also reveals when two or more devices are traveling together within a specified distance and time.
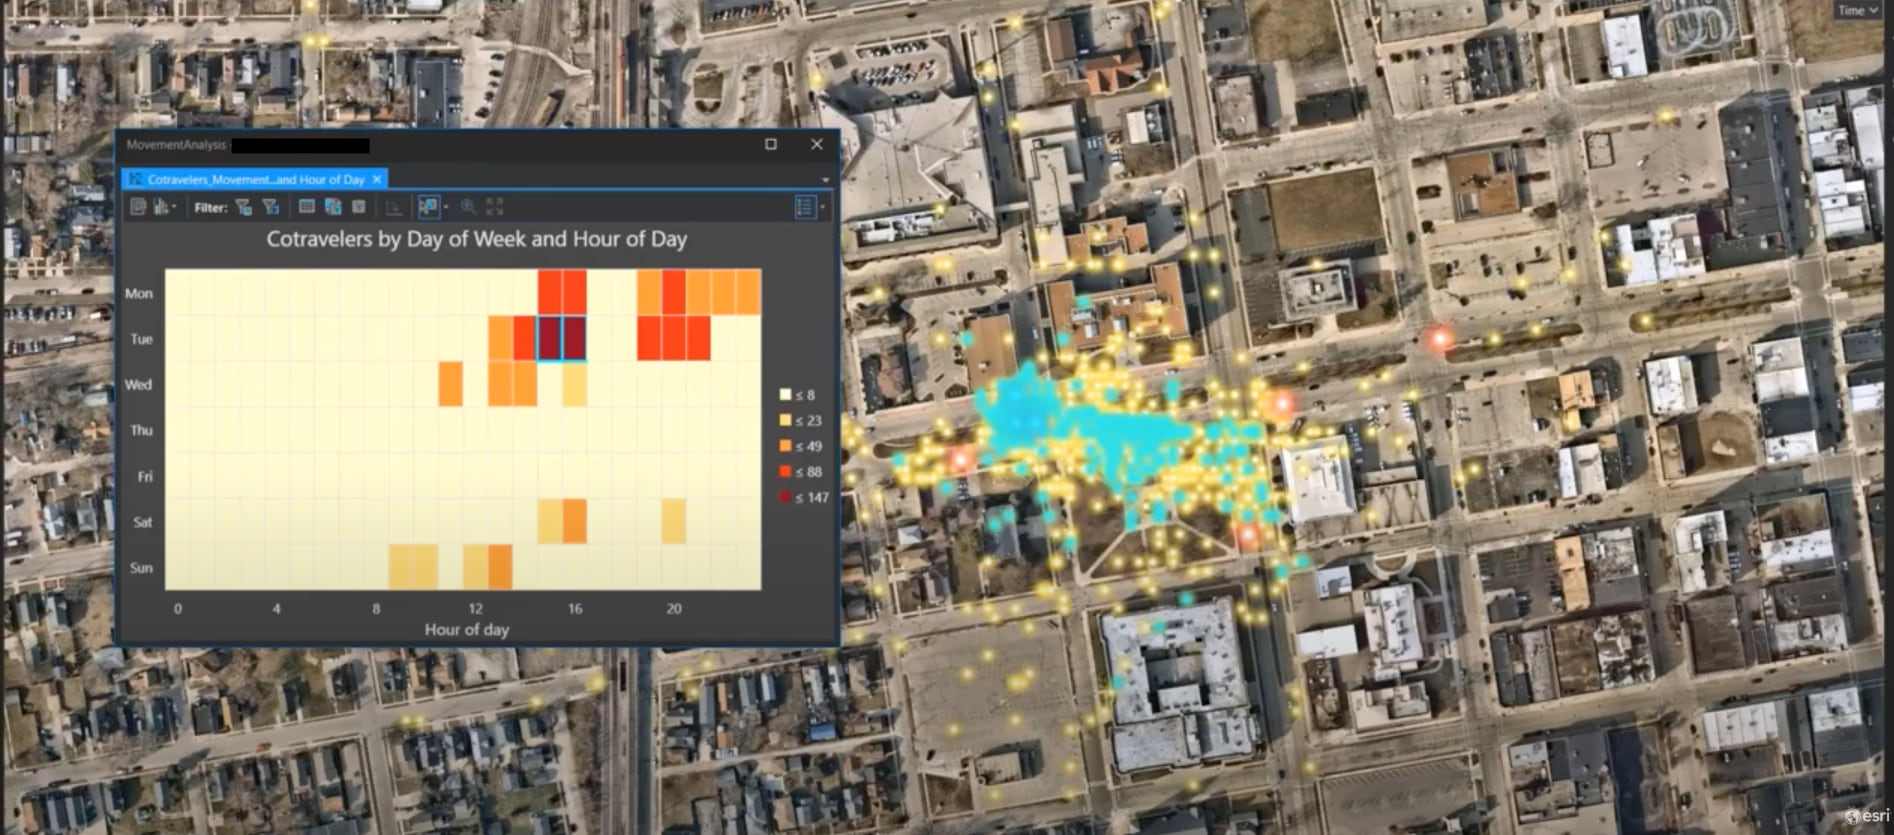
Next, we may want to understand if there is a connection between entities. The tools in ArcGIS AllSource can also help you see if entities are working together or if they are associated through their travel behaviors alone. The Find Cotravelers tool for example, answers the question “who is traveling together?”. This tool can identify devices that may have been traveling together by comparing nearby tracks within a time interval to find behaviorally relevant relationships.
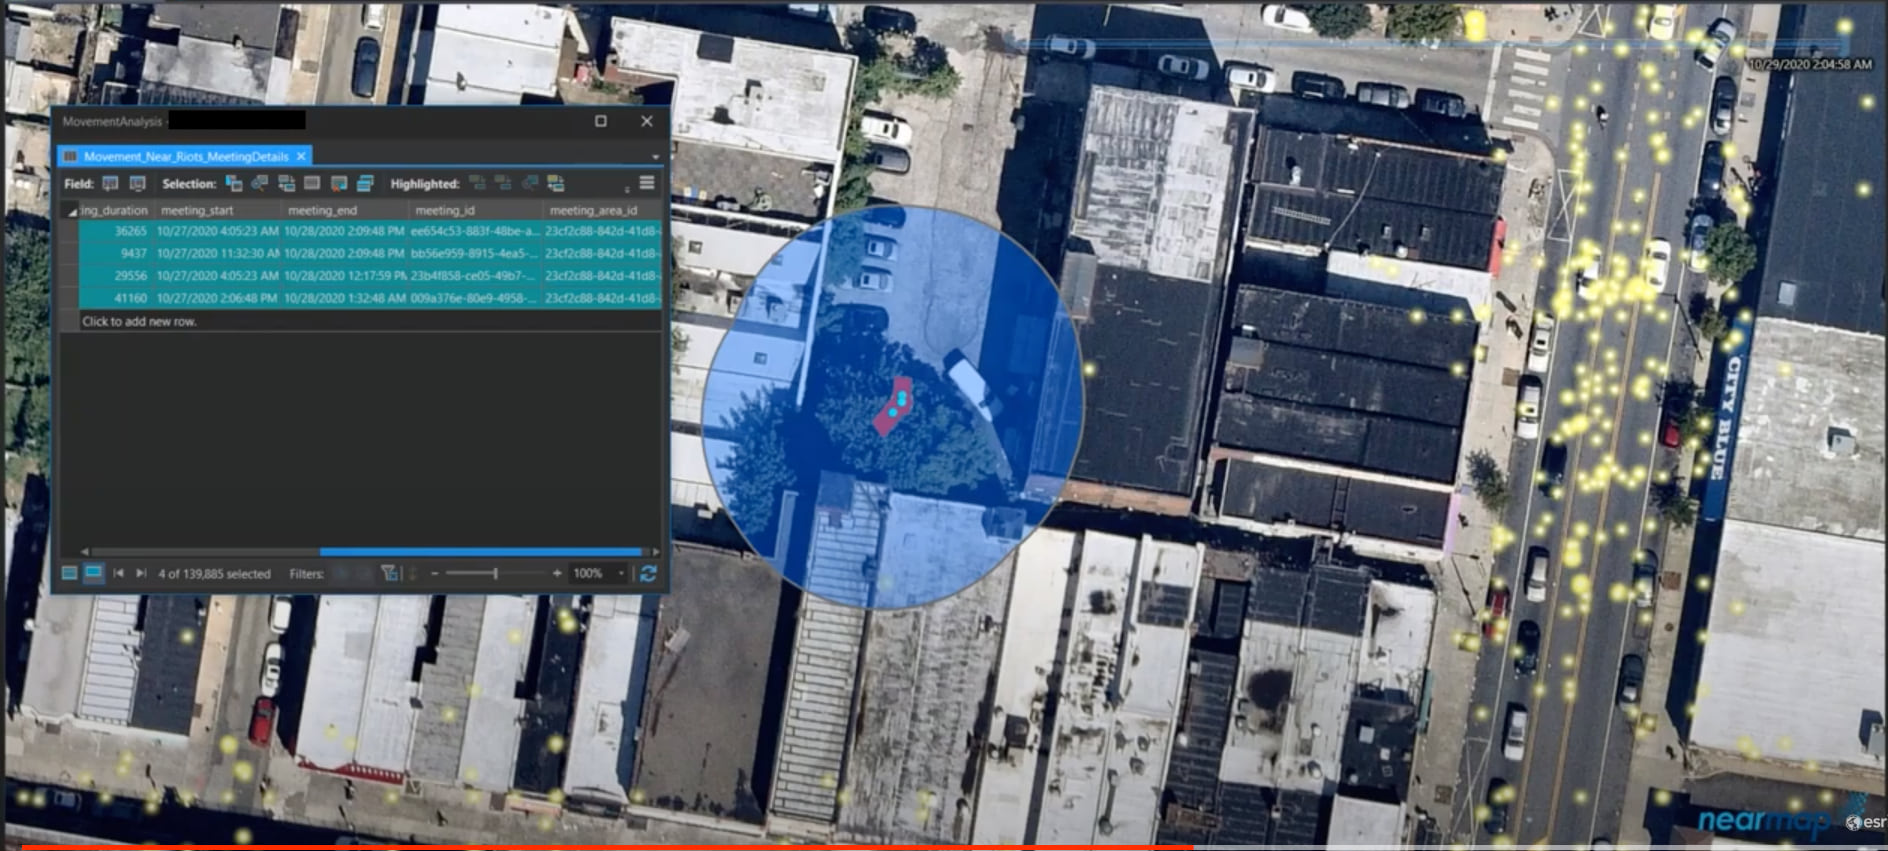
In other cases, you may need to pinpoint areas where devices are showing up together and determine how long the devices are at a specific location. The Find Meeting Locations tool identifies areas where separate devices are stopping together and can help identify who, where, or how long individuals are loitering together.
More Than Dots on a Map
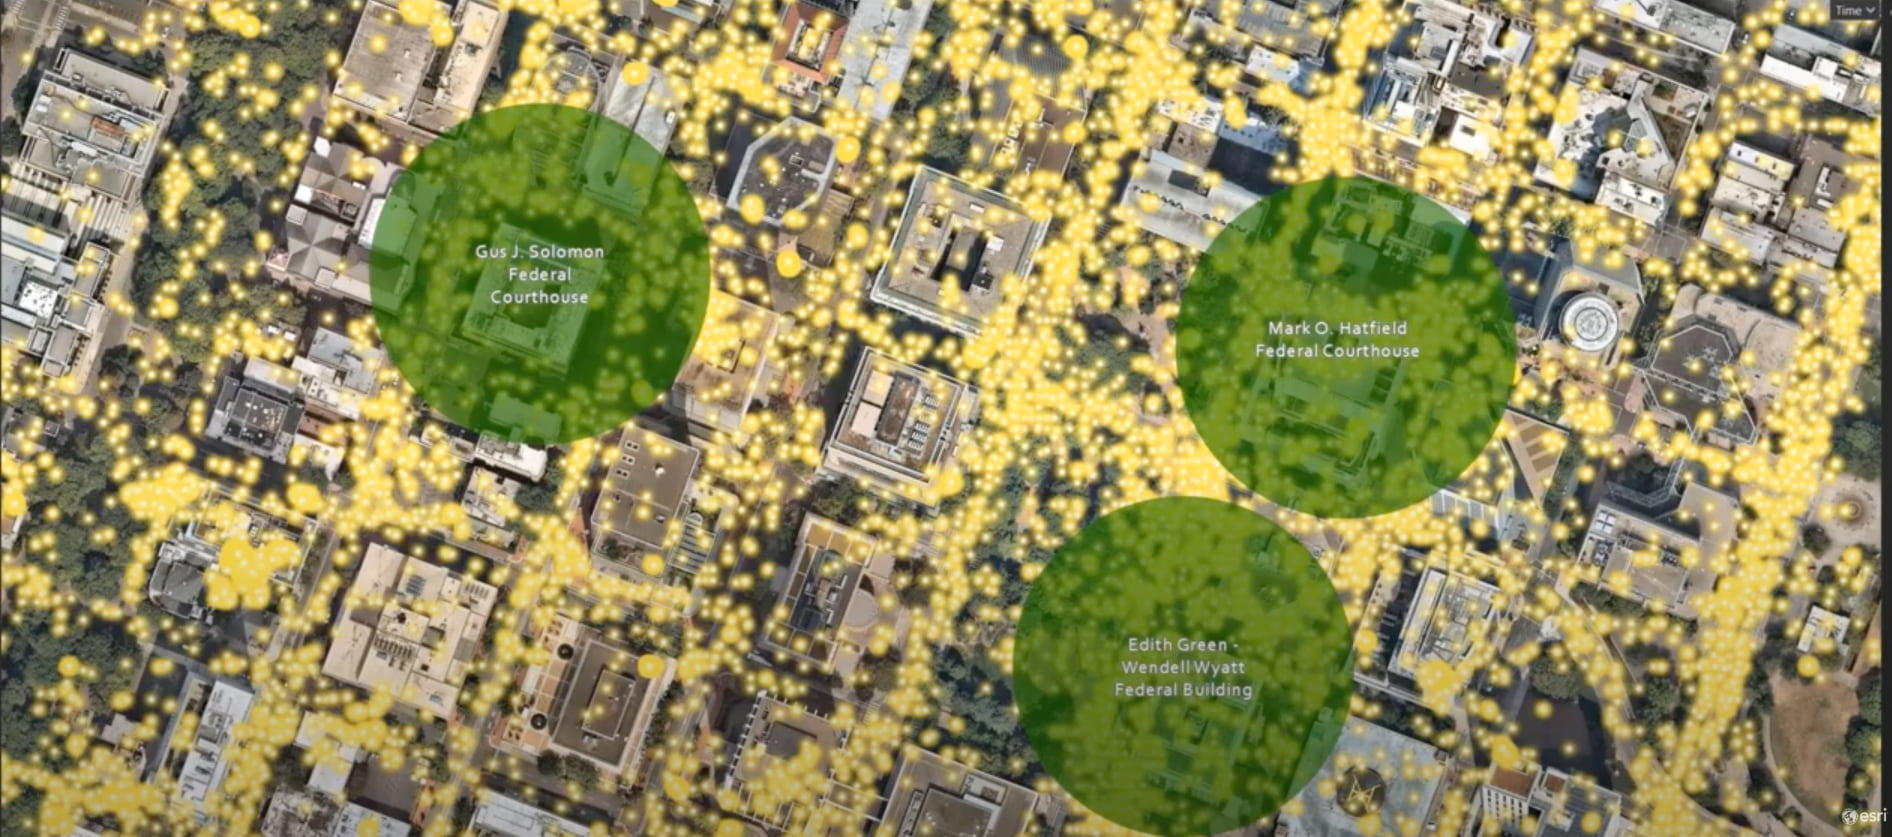
In this scenario, you have known areas of interest around protected federal facilities. You want to find out which devices were present at each location and for how long. You are also interested in understanding if there was a unique device present at more than one location of interest. The Compare Unique Device counts across multiple known areas of interest, like protected federal facilities, could inform security decision making.
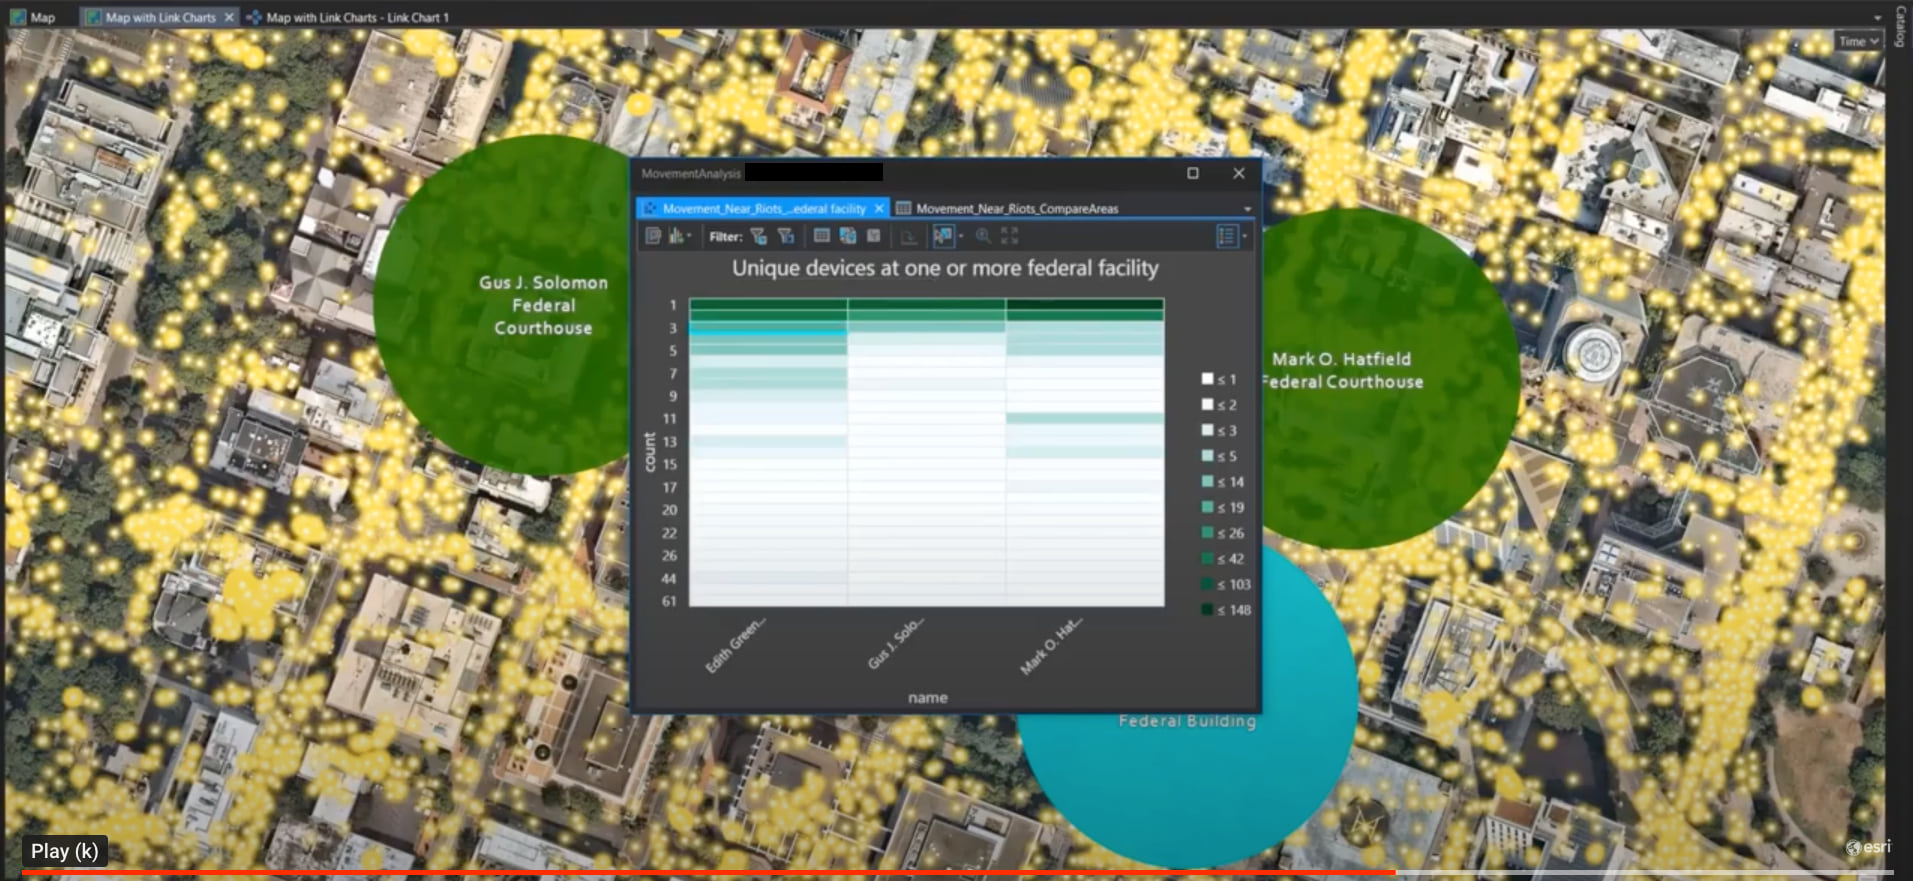
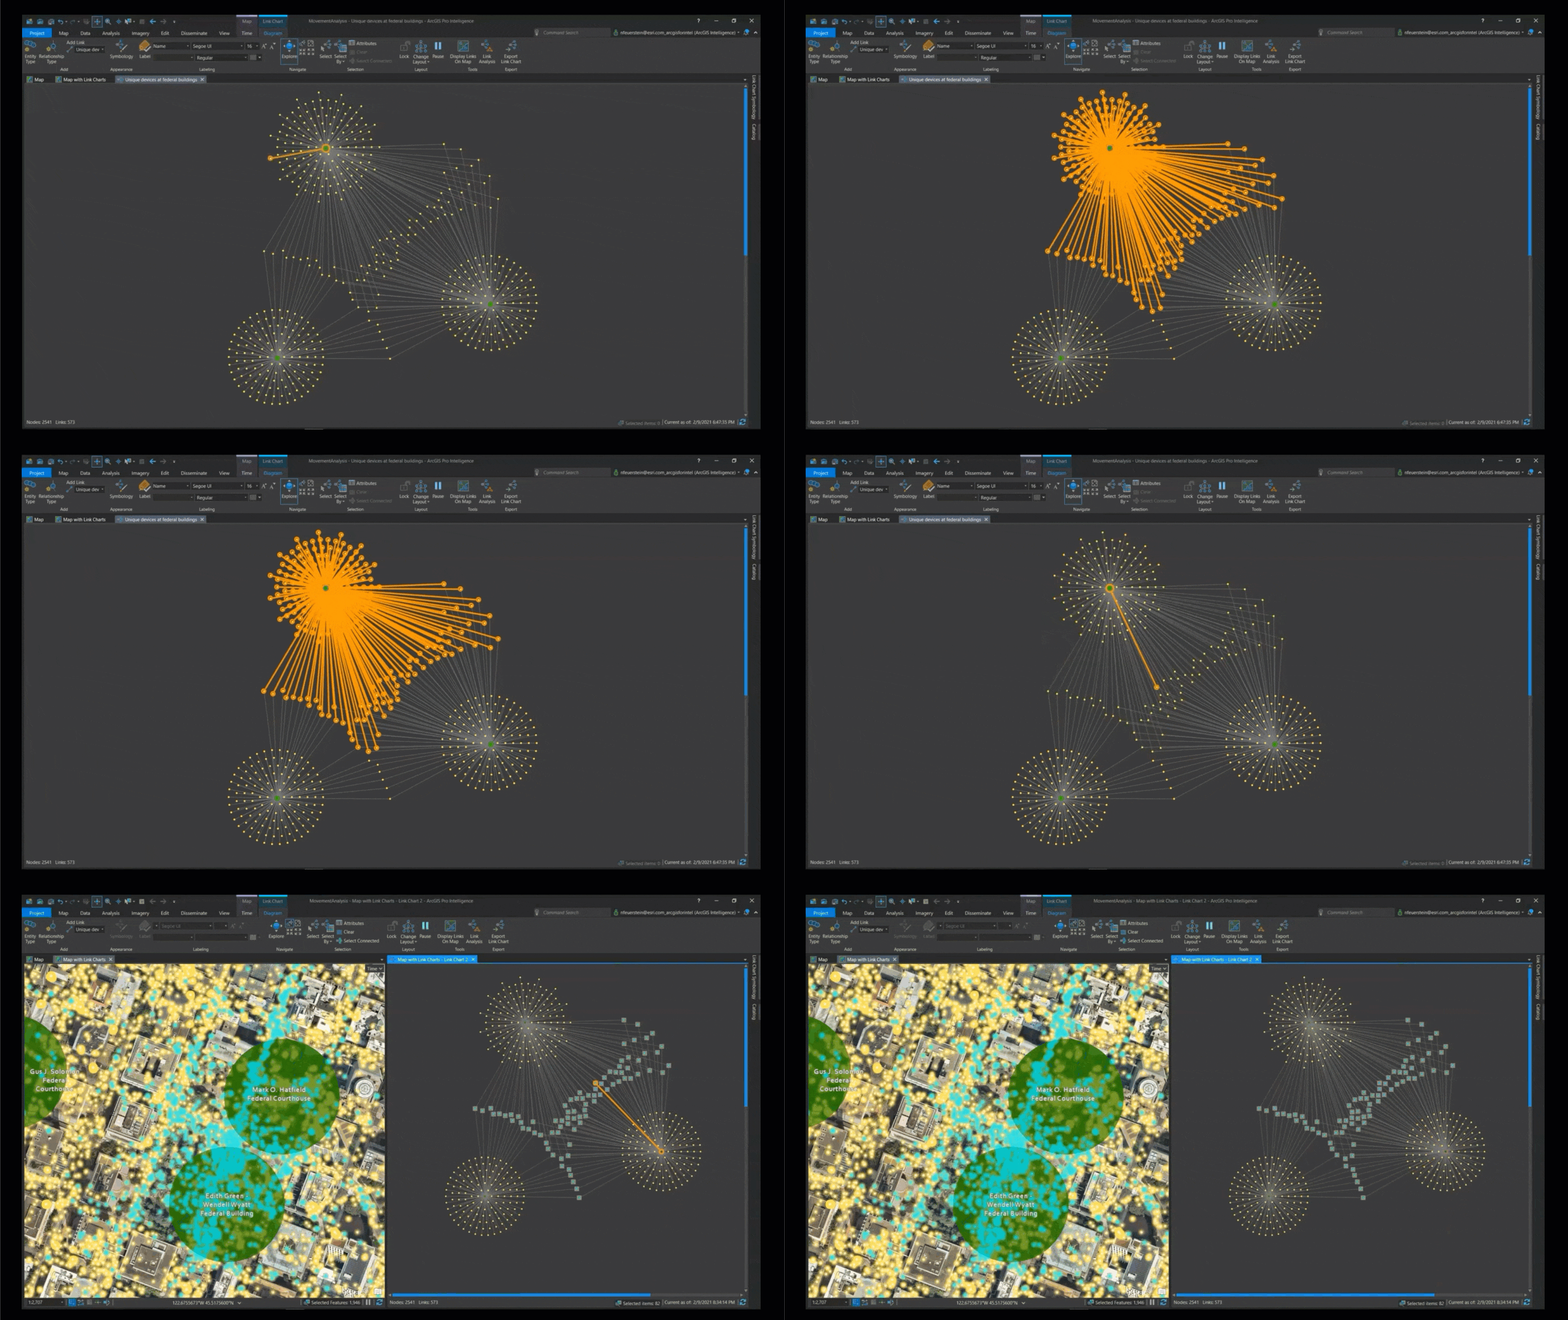
The movement analysis tools in AllSource can help you to quickly derive meaning from massive amounts of collected data and infer possible relationships. It shows that two entities may have a relationship if they are repeatedly counted in both space and time. By using movement tools and link analysis, you can quickly uncover these hidden relationships in your data with ease.
Conclusion
ArcGIS AllSource adapts to meet your mission, whether you need to understand patterns of life (PoL), conduct movement analysis, or provide investigative support. Through the use of maps, imagery, link analysis, and graphs, AllSource enables intelligence professionals to uncover patterns, trends, and relationships to inform decision making. ArcGIS supports intelligence analysts and auditors in the military, civilian intelligence agencies, law enforcement, and the private sector. ArcGIS AllSource is interoperable and extensible, supporting your data integration strategy across multiple domains, in connected, disconnected, and air-gapped networks.


Article Discussion: