The process of aggregating and summarizing point data into equal sized connected hexagons is called hexagonal binning. This has become increasingly popular because creating thematic maps with hexagons is an effective way to visualize patterns and clusters in your data especially when a large number points overlapping each other. For more information on hexagonal binning, see our previous blog posts thematic mapping with hexagons and using binning technique.
With the ArcGIS Online July 2015 update, ArcGIS Online spatial analysis tools now added build-in Living Atlas Analysis Layer gallery. The gallery contains a collection of common geography layers such as country, state, and census boundaries useful for many analyses. Also included in these ready-to-use layers are hexbins for different regions in the world with different resolutions.
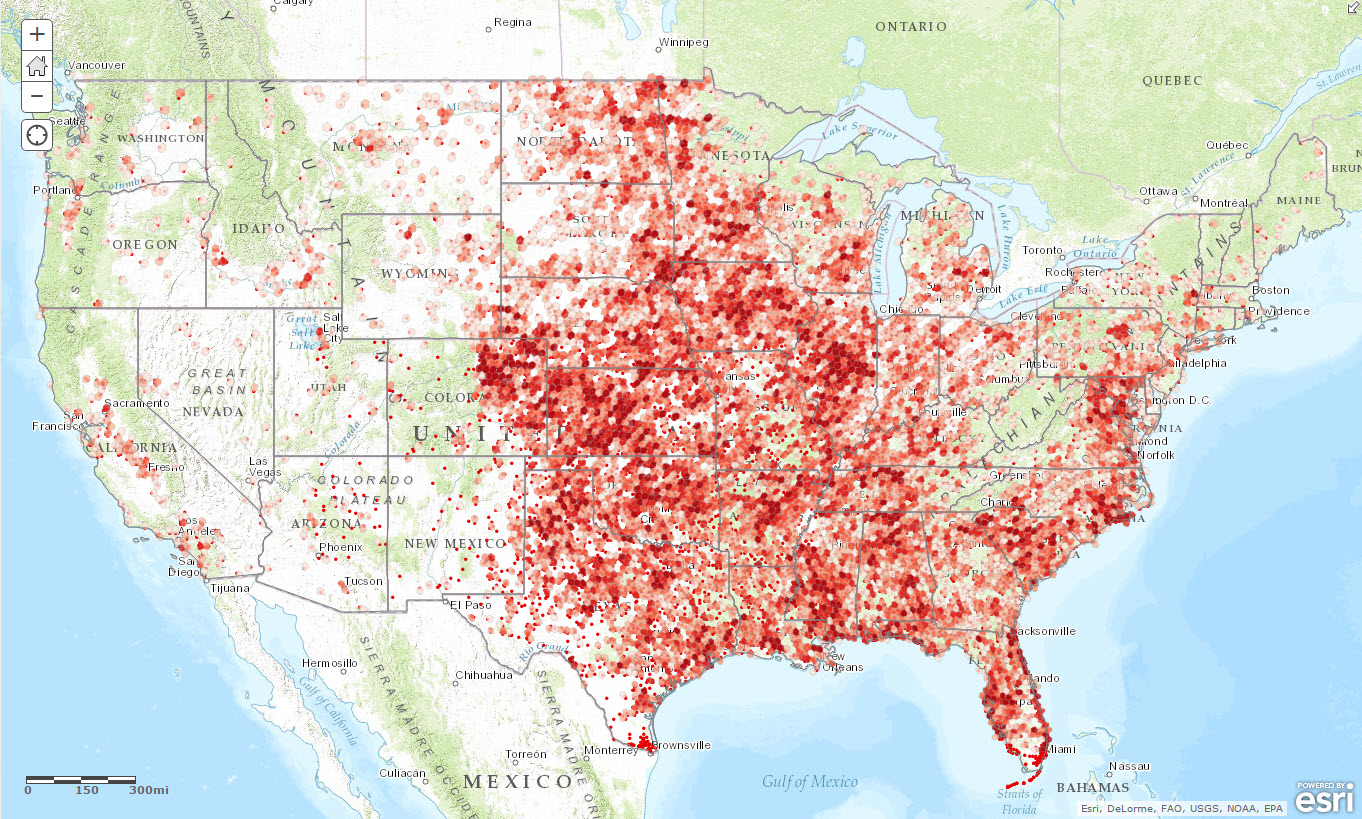
Here is an example of how to aggregate US tornado locations into hexagons in ArcGIS Online. The following web map shows approximately 19,000 points covering 15 years (From 1994 to 2008) of tornadoes in the USA.
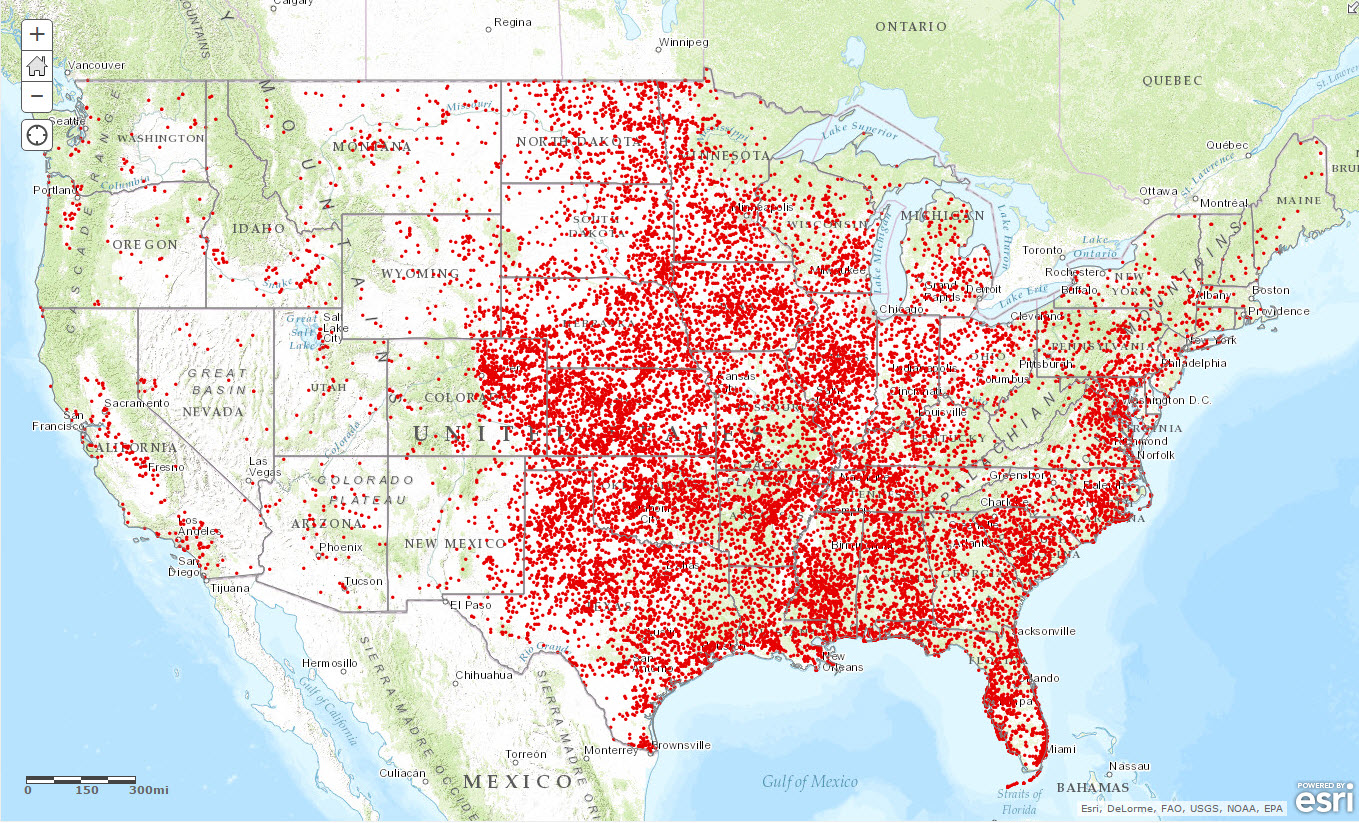
As you can see, it’s hard to see where tornadoes mostly occur in the US because points are overlapping each other.
Now let’s aggregate the tornado locations into 25km hexagons. To do so, select Analysis from the menu:![]()
Then choose “Aggregate Points” in Summarize Data category: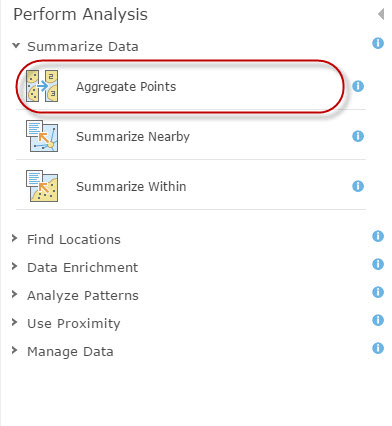
The USATornados is the point layer that contains all the tornado locations. To choose layer containing aggregation areas, notice that you have the option to “Choose Living Atlas Analysis Layer”: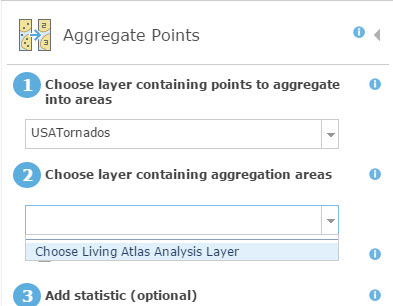
From the Living Atlas Analysis Layer gallery, you can then choose “Hexbins” category: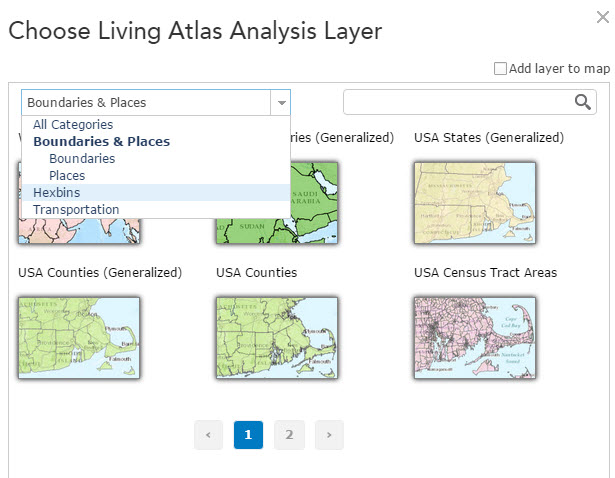
You can see that there are different layers of hexbins available covering different regions and also with different resolutions. We choose “North America Hexbins 25km” for our purposes.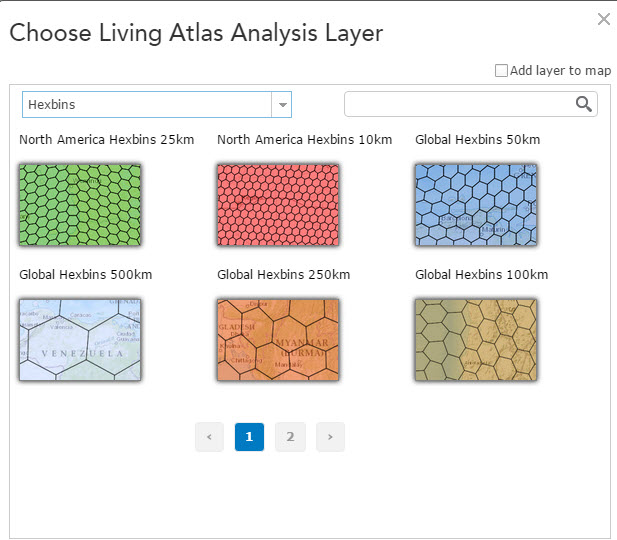
Now make sure you uncheck the option “keep areas with no points” therefore the results will not include hexagons that have no tornadoes in them.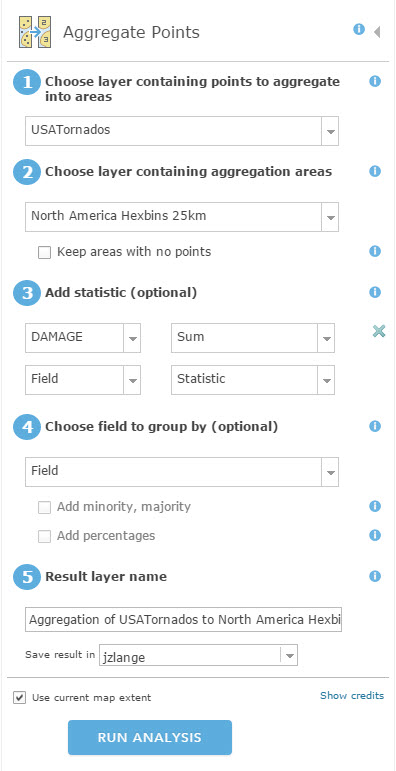
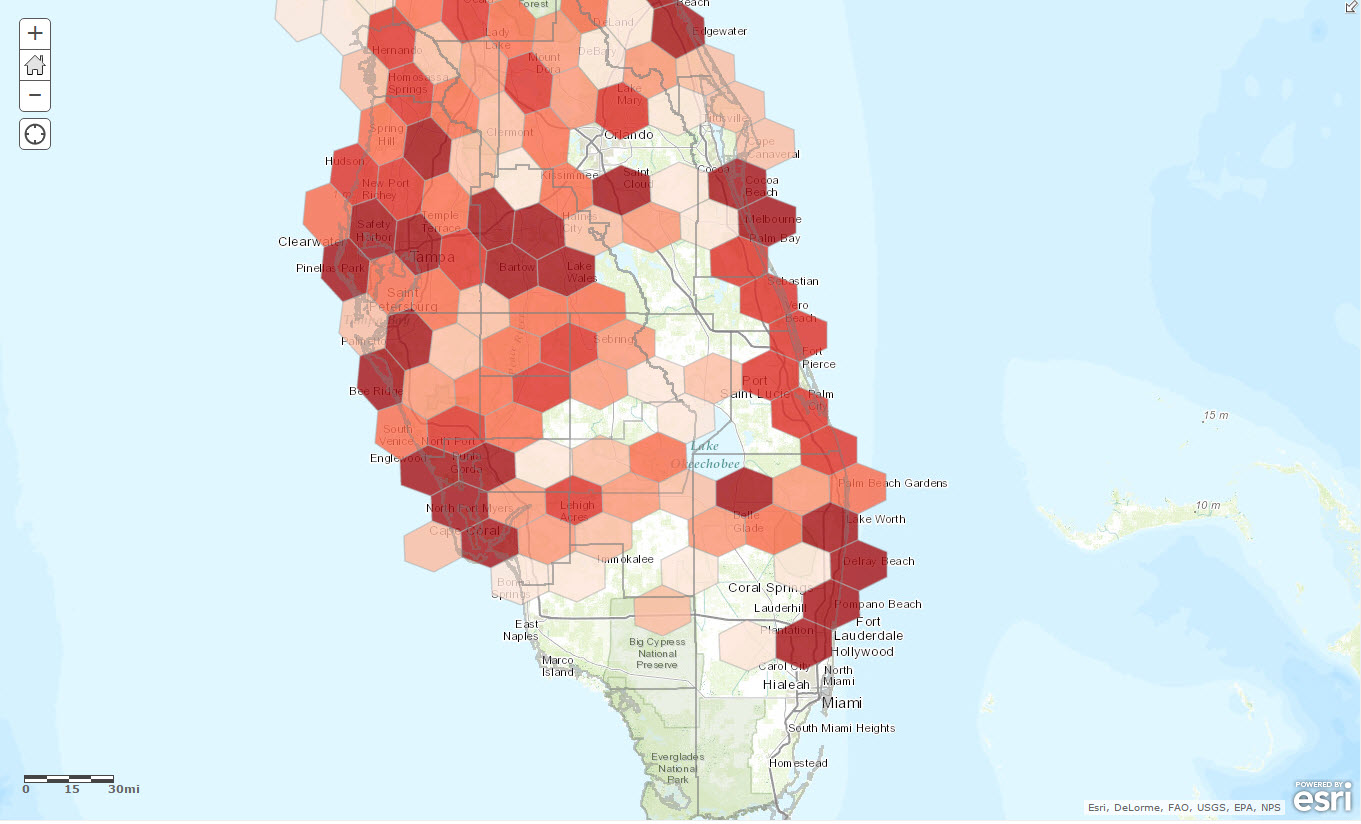
After the analysis is completed, the result layer is shown on the web map. Since all the hexagons are in equal areas, we changed the default symbology to a choropleth map based on the number of tornadoes fall within each hexagon.
Now the pattern of the tornadoes is much easier and to see it’s also more visually appealing.
Here is the same web map zoomed into south Florida area:
With ArcGIS Online analysis tools, it is easier to aggregate points into hexagons because there are ready-to-use hexbins available for multiple regions in multiple scales in the new Living Atlas Analysis Layer gallery. We welcome you to try it out and let us know what you think.

Article Discussion: