Insights‘ drag and drop interface is unique in the ArcGIS platform. These tips will help you use drag and drop to make the most out of your analysis in Insights.
Create maps, charts, and tables
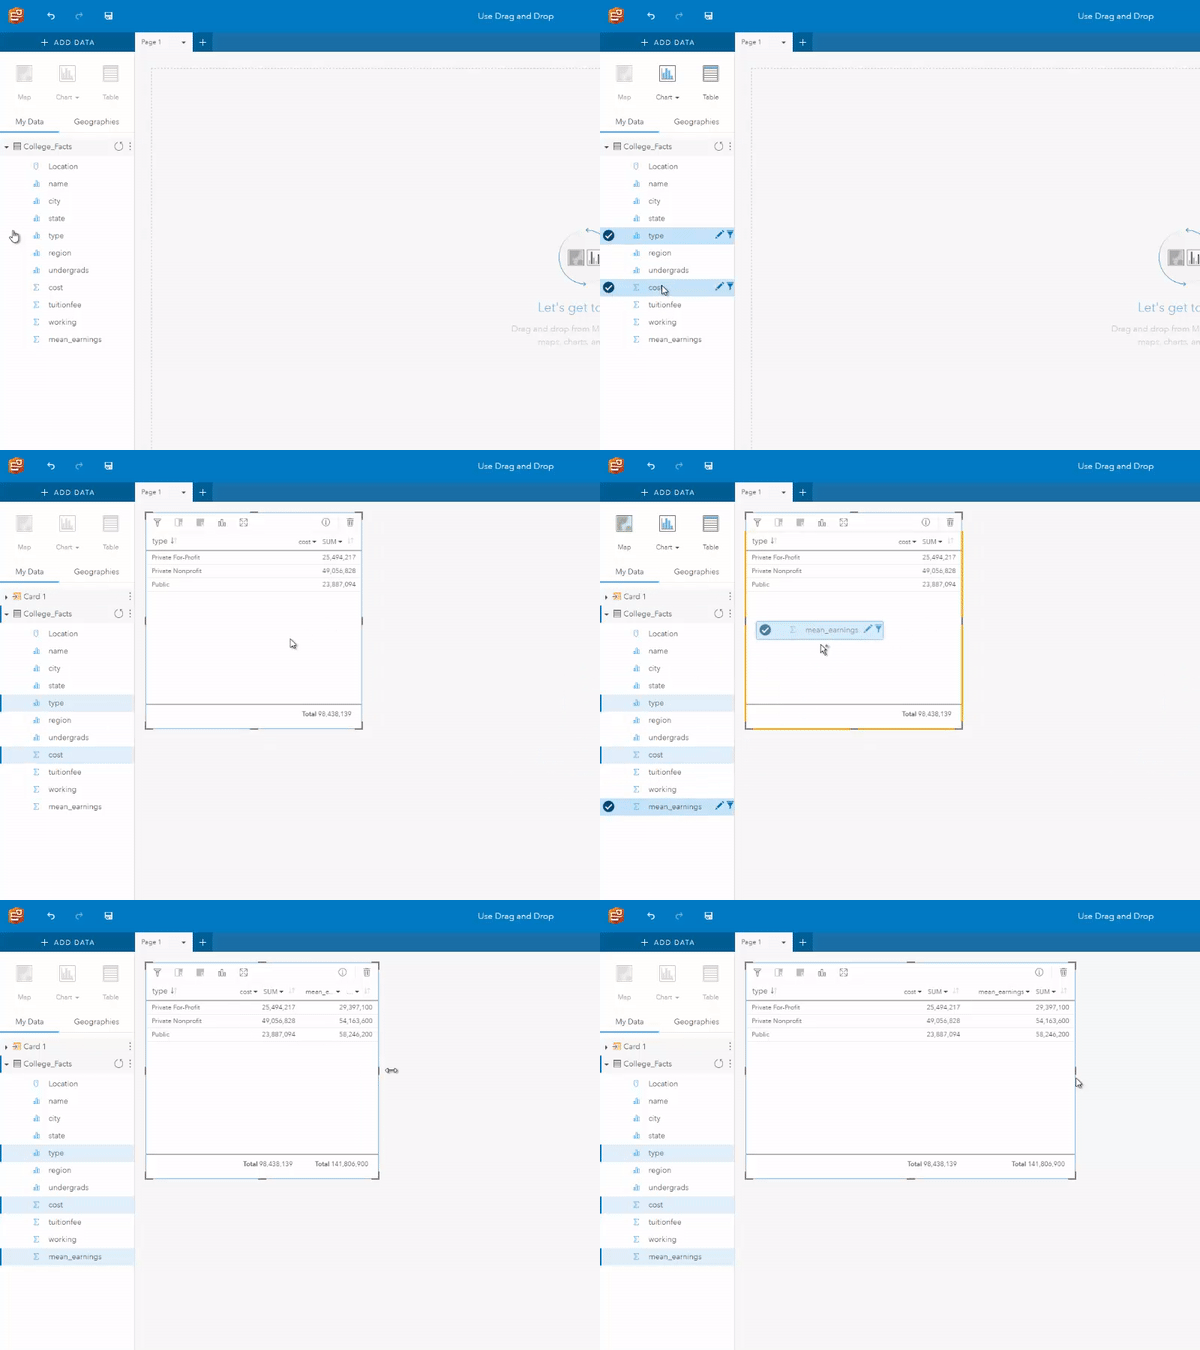
Dragging and dropping datasets or fields to create maps, charts, and tables is a great way to get started with your analysis. Have you ever found yourself with a new dataset that you wanted to explore but you didn’t know where to start? Try looking for fields that stand out to you and using drag and drop to change the style of your map or create a new chart. Style is changed when you drag a field onto an existing map for the same dataset and charts are created by dragging one or more field to the Create Chart drop zone.

You can also use drag and drop to add to or replace fields on your chart or table. Adding and replacing fields is done by dragging a new field to an existing chart or table card. Insights uses smart defaults when creating cards and updating cards, so your results will always be the best format for the data you provide, allowing you to focus more on your analysis.
Aggregate and filter data
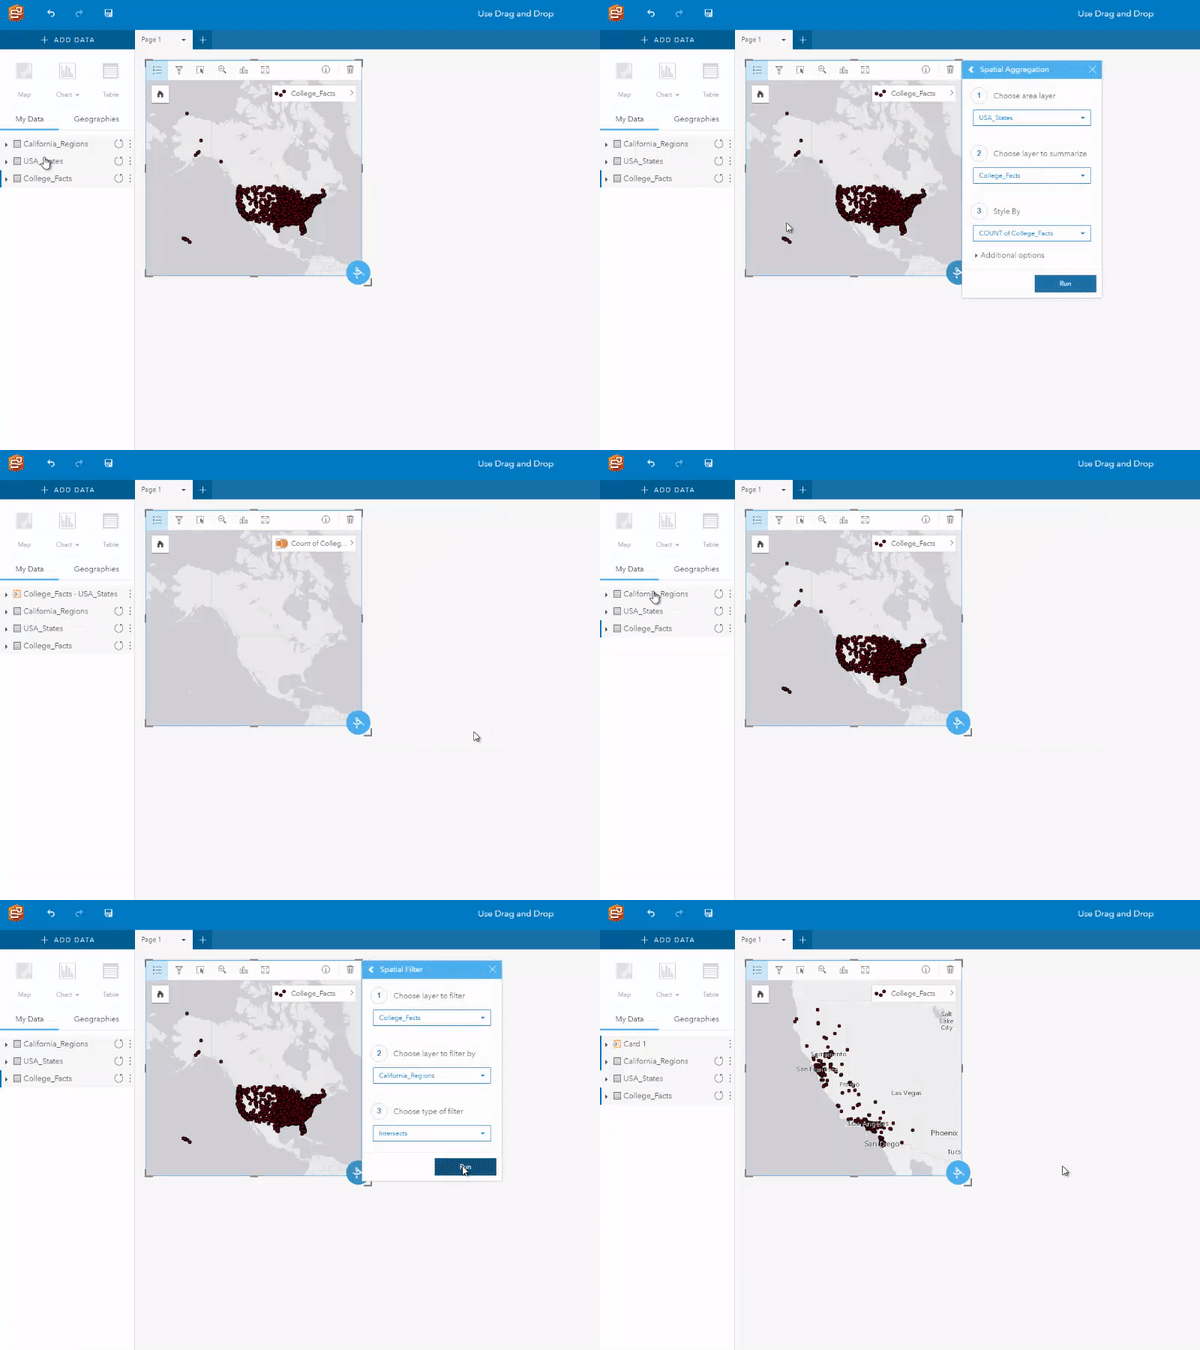
The Spatial Aggregation and Spatial Filter tools can be easily accessed using drop zones on your cards. Drop zones make it quick and easy to add new layers to a map or run commonly used tools. Having analysis tools readily available using drag and drop means you can perform your analysis as each step occurs without needing to search through all of the analysis tools.
Use selections
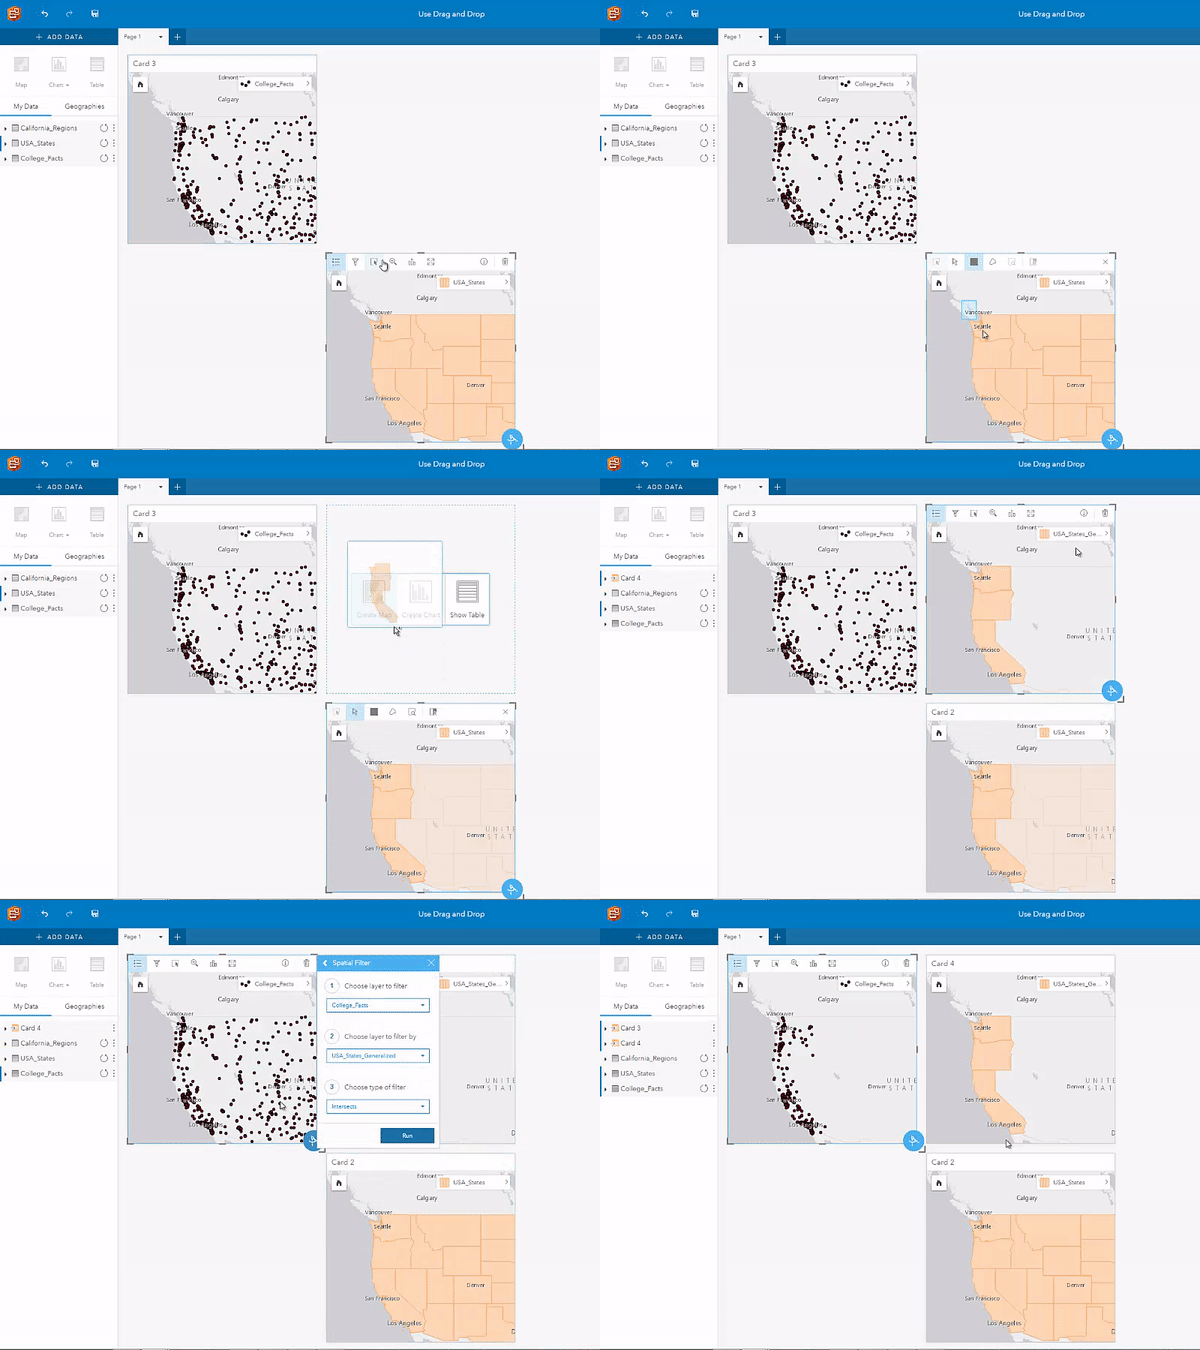
One of my favorite tips for anyone who is new to Insights is to use selections along with drag and drop to create new datasets or perform analysis. When you drag and drop a subset of your data to a new card, a result dataset will appear in My Data containing only the selected features. You can use this dataset the same way you would use any other dataset, including to create charts and run analysis tools. You can also drag and drop selected features to the Spatial aggregation and Filter by selected feature drop zones.

Commenting is not enabled for this article.