Have you ever developed elevation-storage relationships for water reservoirs? Did you find it to be a manual and tedious process? Historically, this is not an unusual experience, especially if you needed to assess those relationships over multiple sites while maintaining a reasonably high degree of accuracy with your results. A fast and automated solution to this problem is now available with the introduction of the Storage Capacity tool to the Spatial Analyst Supplemental Toolbox. With this tool, it is possible to obtain tailored elevation-storage relationships for your reservoir of choice. Read on for more details on the capabilities this tool has to offer!
Background
One of the most fundamental physical characteristics of a reservoir is its elevation-storage curve. These curves find use in flood routing, which is the process of determining the timing and shape of a flood wave at successive locations along a river. As a flood wave propagates through a reservoir, its peak discharge is delayed and weakened. This weakening of the flood wave can be predicted, for varying storm intensities, by using an elevation-storage curve. Principal users of this technique are often interested in forecasting river water levels, determining effects of flood control projects, and scheduling hydroelectric operations according to predicted progress of a flood wave.
What does the tool do?
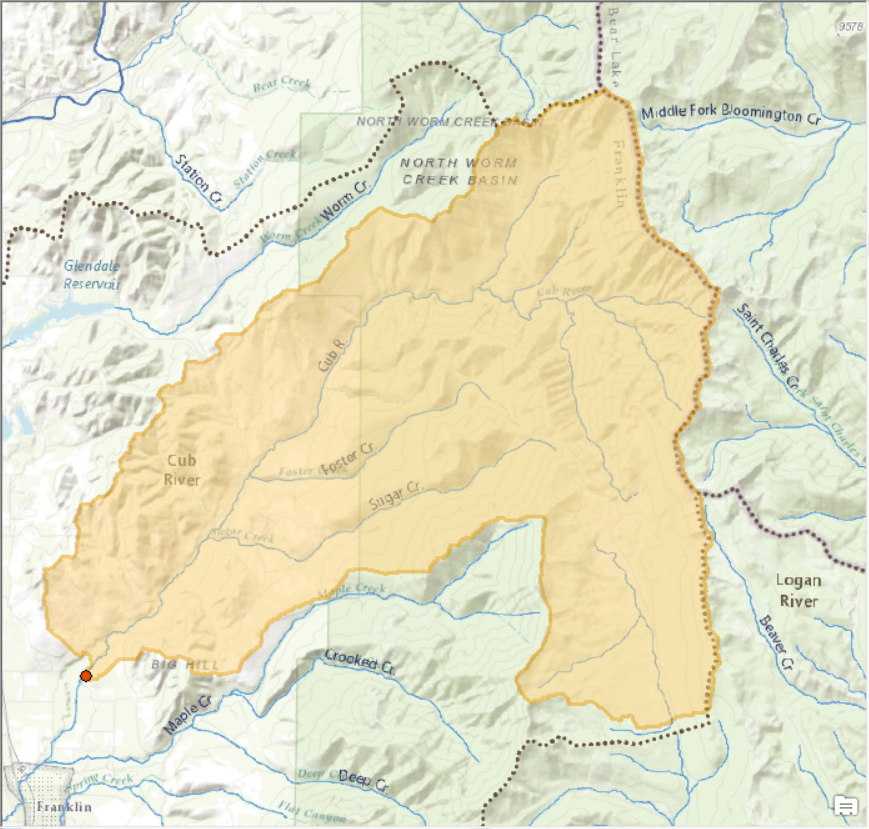
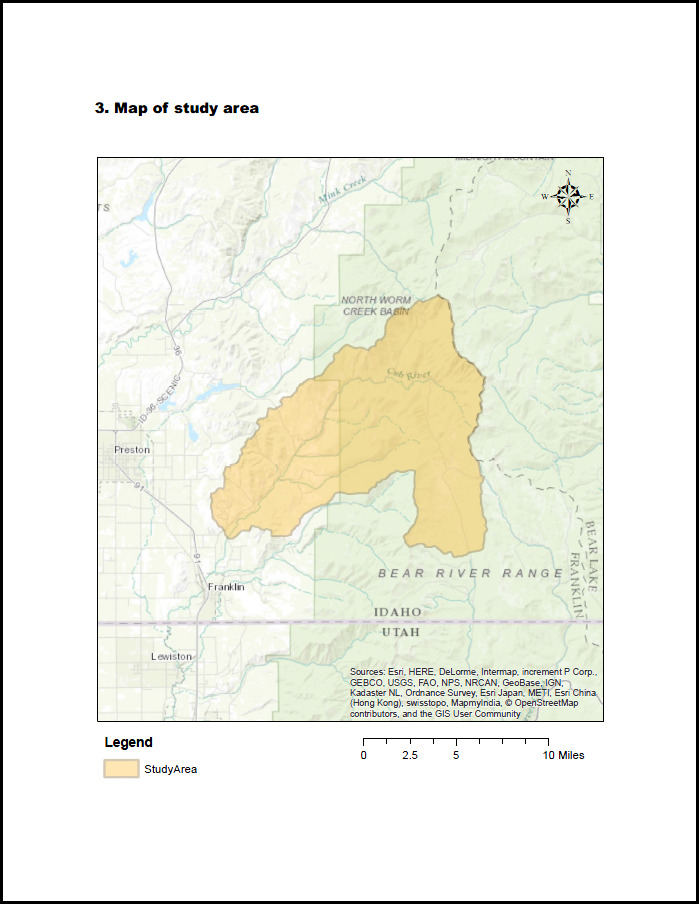
In order to understand what this tool does, let’s look at an example. I will use the Cub River Watershed draining to USGS streamflow gauge #100096000 located north of Preston, Idaho. The map below displays the study area for this site.
There are three inputs that can be provided to this tool:
- An elevation model of a reservoir for which you wish to obtain an elevation-storage relationship.
- A polygon of a specific reservoir or watershed, if you wish to narrow down the analysis domain instead of analyzing over the entire extent of the elevation model.
- The range and interval of elevation values to use for storage calculations. Optionally, you would set an appropriate Z factor if the elevation model’s vertical z-units are different from ground x-, y-units.
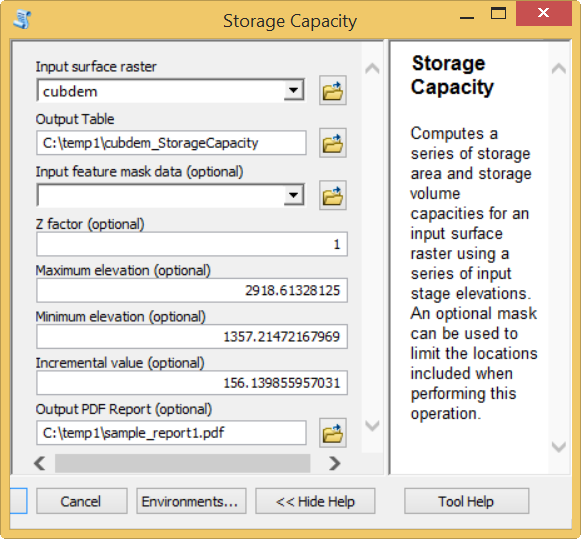
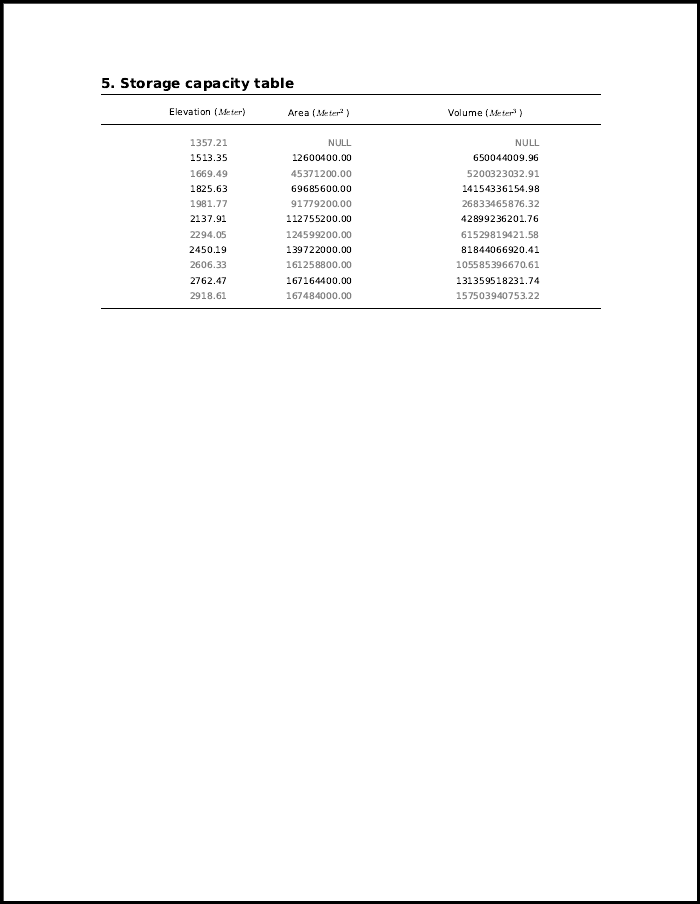
Based on your choice on minimum, maximum and incremental elevation, the tool computes the cumulative volume and surface area below an elevation for a given set of elevation values. The results of this computation are stored as a table. The table created for this example is shown below.
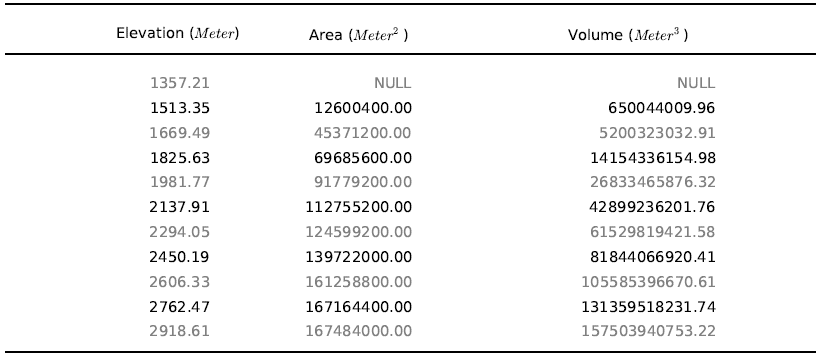
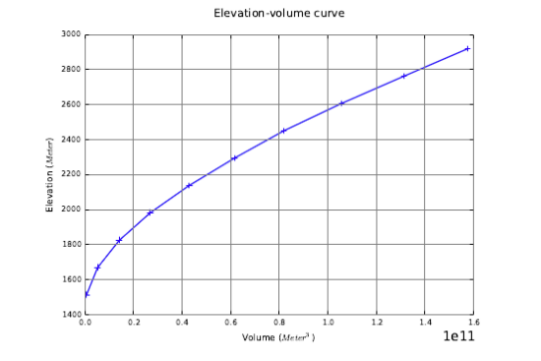
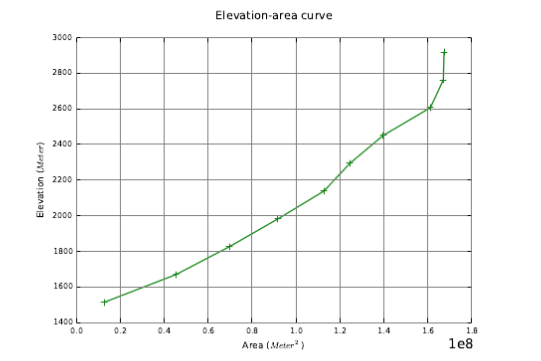
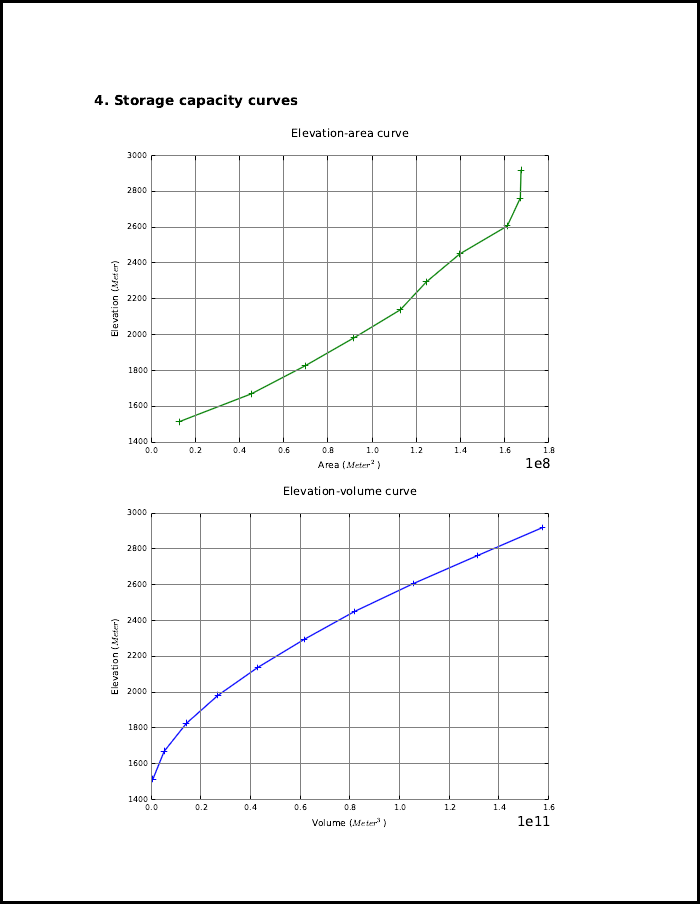
The elevation-storage relationships in this table can be plotted to obtain storage capacity curves, as shown below.
This tool can also generate a PDF report containing a map of the study area and the resulting elevation-storage relationships in both graphical and tabular form.
What is in the report?
The report includes:
- Dataset names and file paths
- Maximum, minimum and incremental elevations
- A map of the study area
- Elevation-storage curves
- Elevation-storage table
A scaled down version of the report is shown here.

Downloading and installing
Once you’ve downloaded and installed the updated Spatial Analyst Supplemental tools, give this tool a try on a watershed of your choice.
Note that this tool is geared for ArcGIS version 10.4 and beyond.
Other tools
For more information on the other Supplemental tools that are available, have a look at this blog post:

Commenting is not enabled for this article.