The Applied Analysis team has been hard at work developing scenario-based, cross platform exercises to help you learn spatial analysis techniques for solving your real-world problems. Each case study includes data and step by step workflows for multiple ArcGIS applications, such as ArcGIS Pro, ArcMap, ArcGIS Online, and Insights for ArcGIS. Most of the case studies discuss key analysis concepts and lessons such as how to deal with missing data, how to explore and take advantage of the spatial structure in your data, how to model supply versus demand, how to transform data, and how to select an appropriate weighting scheme. Work through the case study analyses using the data provided, and then adapt the workflows to your own data.
Exploratory analysis
Exploratory analysis is a technique that helps you explore and learn more about the patterns and distributions in your data. Exploratory analysis can either stand alone as a complete analysis, or be used as a starting point for another type of analysis, making exploratory techniques some of the most essential and ubiquitous techniques in spatial analysis. Exploratory analysis is used in almost every industry, including health, public works, retail, and natural resources. Here are some case studies that use exploratory analysis techniques:
- Which college district has the fewest low-income families? – Explore local college districts to find which would serve as the best for an internet pilot program.
- Who lives in the neighborhood surrounding each library branch? – Explore the demographics around library branches to determine which community programs would be best suited to each branch.
Suitability analysis
Suitability analysis is one of the most commonly used GIS analysis techniques, and for good reason. This type of analysis has broad application for a diverse set of industries, including economic development, urban and regional planning, retail, manufacturing, environmental management, and public safety. While the problems may be diverse, the analysis follows the same basic steps: determine a set of suitable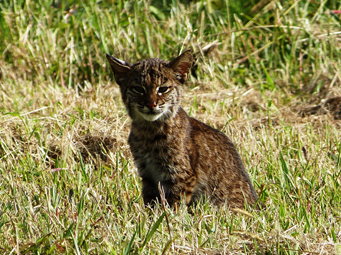 criteria, apply the criteria to your data, and derive results that fit that criteria. Here are some examples of case studies that use suitability analysis:
- Understand suitability modeling – An in-depth look at how to use ArcGIS Spatial Analyst for suitability analysis using bobcat habitat in Vermont as an example.
- Where are the best locations for a golf resort? – Use ArcGIS Pro to find which privately-owned land parcels are the most suitable for building a new golf resort.
- Which areas are good cougar habitat? – Use ArcGIS Online or ArcMap to determine the most suitable cougar habitat around a state park.
- Which parcels are suitable sites for a fire station? – Apply suitability analysis techniques to urban planning and find the best locations for a new fire station.
- Minimizing the environmental impact of wind farm installation – Perform a preliminary suitability analysis to remove wind farm applications that are in or near protected areas.
Cost distance analysis
Cost distance analysis is a technique used to determine how a traveler should move through a landscape based on a set of resistance criteria. The result of cost distance analysis is a least cost path – a path of least resistance between a start and end location – or a network of paths that optimally connect a set of desired locations. Cost distance analysis is very popular in sectors related to wildlife because it allows planners to design the best configuration of wildlife corridors to allow the species to move between habitat patches. Cost distance analysis can also be used for other applications, like creating routes for new roads, trails, electrical lines, or pipes, as well as identifying the best movement paths for fire fighting or military operations. Here is an example of a case study that uses cost distance analysis:
- Understanding cost distance analysis – An in-depth look at how to use ArcGIS Spatial Analyst to create the best paths between bobcat habitat patches.
Analyzing spatial clustering
When we look out at the world around us, we see clustering: disease outbreaks around tainted water sources affect aid distribution, shoppers  cluster in space and time creating economic opportunities, and there are crime and traffic accident hot spots affecting public safety. Analysis of clusters and clustering is important for a large variety of industries including elections and redistricting, urban and regional planning, insurance, retail, real estate, banking, telecommunications, water resources, defense, education, health and human services, transportation, and public safety. The case studies below explore statistically significant hot and cold spot areas in space and time, or rank locations based on their similarities and differences:
- Analyzing traffic accidents in space and time – A spatial and temporal analysis of crash data in Brevard County, Florida based on a road network and accounting for variations in commuting patterns.
- Analyzing violent crime – A spatial and temporal analysis of Chicago’s violent crime in relation to liquor establishments and unemployment.
- Locating a new retirement community – Uses supply versus demand modeling and the factors associated with the most successful communities to narrow potential locations for a new community.
Analyzing correlations
Is average income a good predictor of luxury TV purchases? Do student-to-teacher ratios help explain test score results? We might believe that agricultural areas with the best growing conditions will produce the highest yields, but is that always the case everywhere? If not, why not? Understanding relationships between and among data variables is powerful because it is a first step toward explanation and, ultimately, encouraging positive changes. These methods can be applied to any application area where you want to better understand the factors promoting spatial outcomes. The case studies below use correlation and regression analysis:
- Modeling literacy – Explores key explanatory variables contributing to literacy rates in Africa and uses cluster analysis to suggest targeted country level remediation programs.
- Mapping the geography of online lending – Using regression analysis, finds surprising discrepancies in the expected relationship between average loan grades and average interest rates.
Creating surfaces
Statistical or physical, 2D or 3D, surfaces are an important component of many GIS analyses. Surfaces such as elevation models, temperature maps, or density heat maps are typically modeled as continuous raster surfaces, created from points or contours using interpolation or geostatistical methods. Surfaces are used in analyses associated with a number of different industries including forestry, weather and climate, environmental management, sustainable development, and mining. Here are some examples of case studies that use different geoprocessing tools to create surfaces:
- Selecting an appropriate kriging model using soil contamination data – Learn about kriging models and how to choose the correct one using data from the Chernobyl nuclear disaster.
- Aloha! A GIS vacation – Learn all about 3D analysis after creating a digital elevation model (DEM) from contours for the island of O’ahu.
Network analysis
Routing is probably the most commonly used GIS technique by non-GIS users; everyday people are using maps to find the best route from their home to the store, or from their hotel to the museum. Network analysis takes it a step further to solve complex routing or location problems with complicated sets of variables. Don’t worry though, we’ll walk you through the workflows step-by-step so you’ll barely even notice. Some typical network analysis applications include routing for mail and package delivery, emergency vehicle routing, and location-allocation to site store warehouses or outlets. Here are some examples of case studies that use network analysis:
- Finding the closest fire station – Determine which fire stations should be the primary and secondary responders for emergencies at each school.
- Which areas are within four minutes of a fire station? – Determine how much of the city is within a four minute drive time of its fire stations using different traffic conditions.
- Which site for the new station maximizes fire protection coverage? – Find the best parcel in the city to build a new fire station and maximize coverage.
- Where are the best stops and routes for a bookmobile? – Create routes for bookmobiles to cover areas of the city not currently serviced by an existing branch.
Get started!
What are you waiting for? Look over these case studies to learn some new approaches for analyzing your data. Keep in mind that all of these case studies reflect common workflows that can be generalized to other data and other applications.
Don’t see a case study with your most common workflows? Contact us! We want to help you with your analyses and to write up your story as a case study that will help others!
Are you an instructor? Feel free to use these case studies for classroom exercises.
Photo credits
- Bobcat – Public domain (source)
- Bottles – By Kotivalo (Own work). Licensed under CC BY-SA 3.0 (source)
- Soil – Public domain (source)

Commenting is not enabled for this article.