Have you ever found a table of data with some basic spatial fields like ZIP Codes or states and thought, this would be really interesting data to map? After assigning geospatial locations, have you wondered about the best way to highlight the most compelling locations in your dataset? Whether it’s the highest or lowest values or the most recent dates, there are characteristics within datasets that show the significance of your data to your audience. This two-part blog will outline best-practice workflows to turn tabular data into a geographical listicle using the Geo List configurable app.
As U.S. Tax Day quickly approaches, I thought it would be interesting to look at some specific tax return statistics about 2014 income tax returns published by the IRS. I decided to pick a small subset of the available data, the State of California ZIP Codes, and highlight some specific variables to better understand where residents received tax credits or needed to make payments. There is data available for every state on the website, so feel free to give this project a try in your state.
Part 1: Create spatial data

The dataset needs to be formatted so that there is one ZIP Code per field and only one field per column. To do this, I created a formatted CSV file that contains with some selected variables about refunds and tax creditsper ZIP Code. I then used the Join Features< tool, which was introduced in the ArcGIS Online December 2016 update, to create a new polygon ZIP Code dataset from the CSV. Below are the steps I used and some best practice tips for creating polygon ZIP Code data from a CSV.
- Publish the CSV file as a table:
- Add the Source Polygon Data to Map Viewer
- Open the hosted table in Map Viewer, click the Analysis button, and click the Join Features tool under Summarize Data.
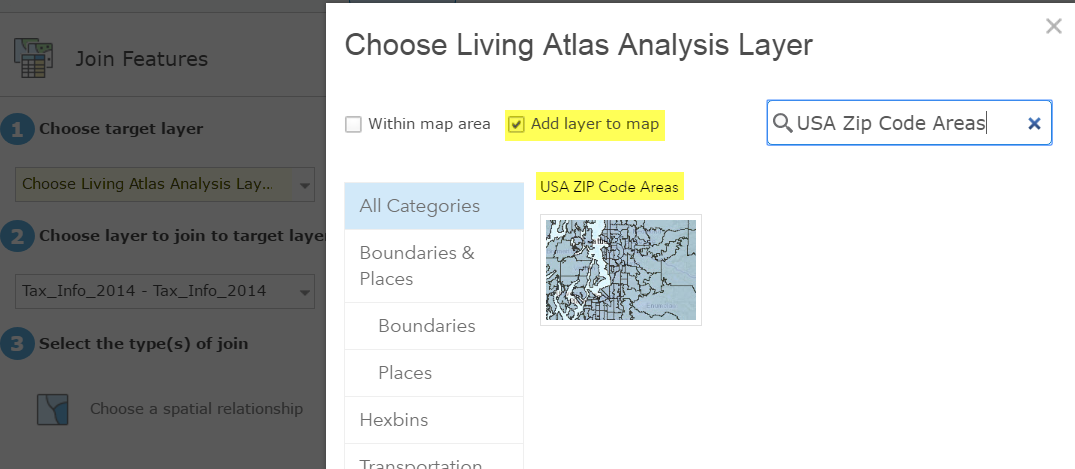
- Under step 1, select Choose Living Atlas Layer and type Zip into the search box. Check the Add layer to map check box and click the USA Zip Code Areas layer. Note. This layer has had the attribute and geometry optimized for use in the analysis tools. In the next step, I will exit the tool box to make some changes to this layer, but going through this workflow is the fastest way to find layers that are optimized for use in analysis tools.
- Filter the source data to show your area of interest

- Click the Details tab in Map Viewer to close the analysis tool pane and click the filter button under the layer.
- As the dataset only contains California ZIP Codes, set a filter on the polygon data so only the state of California is displayed. This will improve performance as it reduces the number of features used in the Join Features tool.
- Use the Join Features tool to create the polygon dataset
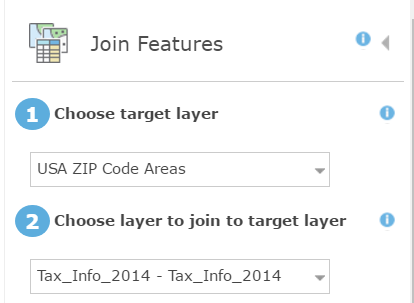
- Open the Join Features tool again and choose the filtered ZIP Code Area layer as the target layer and the table published from the CSV as the join layer.
- Use a One to Many join based on the string ZIP Code fields in both datasets. The One to Many join will result in the fields from the table being added to the target data layer where the ZIP Code fields match as a new layer.
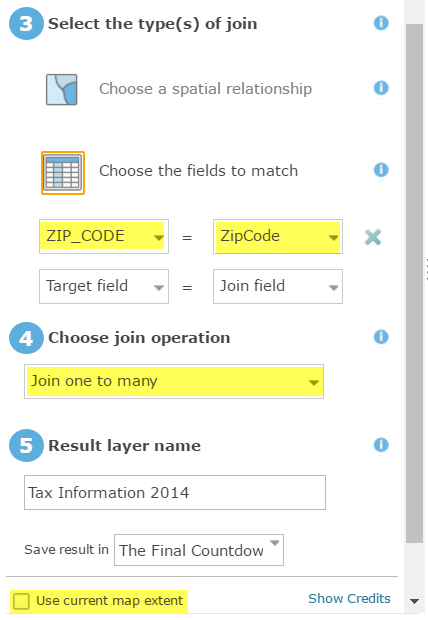 Click the Show Credits option to estimate the credit cost for running the tool. Note: For the Join Features tool, credits are charged based on the total number of records in the target and join layer. For this data, there are 1484 table records in the join layer and 1716 records in the filtered California layer, target layer. This equals 3200 total records, costing 3.2 credits.
- Click Run Analysis and wait for your layer to be returned as a new hosted feature layer
Now that the data has been created, move to Part 2 of this blog to see how the Geo List app can highlight features in your newly created dataset.

Article Discussion: