The ArcGIS API for JavaScript version 3.17 is available today. This release drives many of the new features released in the ArcGIS Online (June 2016) release, and other minor enhancements and bug fixes. For a complete list of changes, see the What’s new in Version 3.17 guide topic.
Smart Mapping: Date – driven visualization
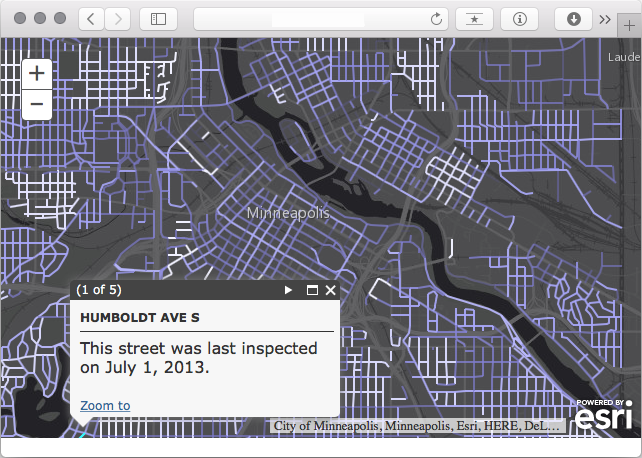
Developers have a new way to visualize temporal aspects in their data. For example, use color to view data sequentially from new to old or before and after a key date, or show a range of dates before and after a key date. Color can also be used to show the age of features using a start date and an end date. You can also size features based on a date with proportional symbols to visualize the dates sequentially on the map. Opacity can also be used to indicate intensity; for example, the newest features could be opaque while the oldest features could be nearly transparent. Date-driven visualization can be used in conjunction with other visual variables (using non-temporal attributes) to bring out other patterns in the data.
Developers (and users) will be able to use Online/Portal’s smart mapping capabilities to visualize data temporally and save it in a web map, which can then be loaded into an app. You can also take advantage of date-driven visualizations directly in code using the JS API.
Feature table enhancements
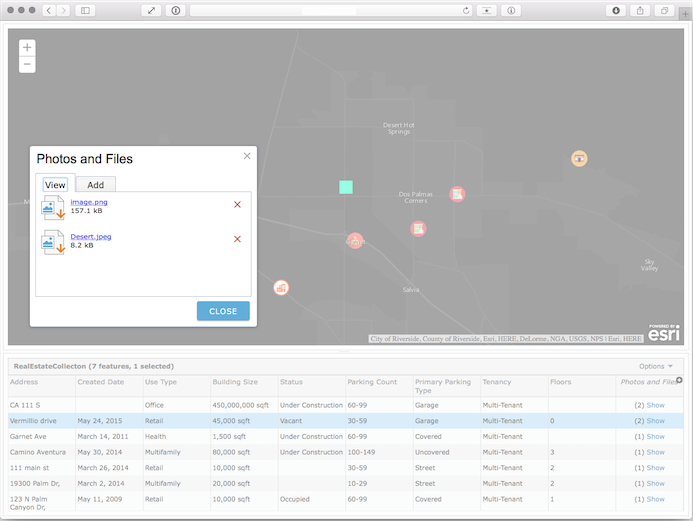
Substantial work went into the feature table in this release. The most significant update is that the FeatureTable now supports attachments. If the developer enables attachments, the end user can view a list of attachments associated with a feature, or even add an attachment that is saved back to the feature service. Several properties were added to the feature table to provide users with more information about the data – for example to show or hide statistics and feature counts. Developers also have more options for customizing the look and feel of the table. Take this new feature for a test drive with the FeatureTable – Formatting sample.
Open Geospatial Consortium (OGC) – WFS, WMS
Esri continues to improve its commitment to open standards and interoperability with enhanced support for OGC services.
In the ArcGIS Online (June 2016) release you are now able to configure certain aspects of WFS layers and save them in web maps; for example, make simple style changes, configure pop-ups, and change transparency. JS API apps can then load the web map to bring the styled WFS layer(s) into apps with a few lines of code. Developers can also customize the WFS layer’s style and create pop-ups directly in their code. The 3.17 release adds support for WFS layers in the legend.
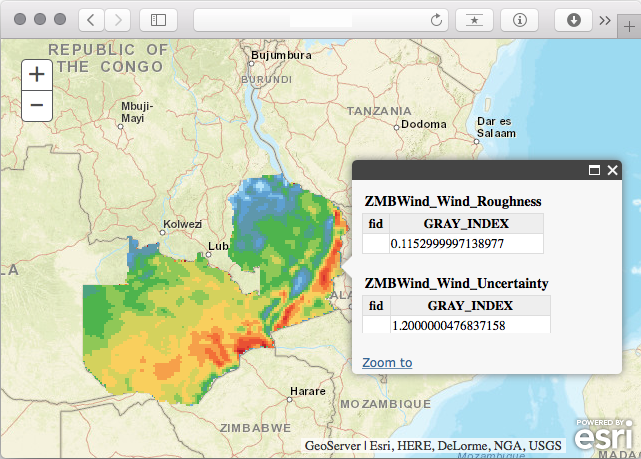
WMS pop-ups can now be enabled in the web map or directly through code. We also added the ability for seamless mapping of WMS layers across the international dateline so you can continuously pan around the world. For more information see the What’s New with OGC Support in ArcGIS Online (June 2016) blog article.
Additional updates and enhancements
- Updates and improvements have been made to the ArcGIS Web Map Specification, use this resource for any specific questions about the web map object.
- The LocateButton which prompts the user for permission to find their location, now automatically hides when used in a non-secure (
http) environment. - The Measurement widget now displays coordinates in latitude, longitude order. Previously it showed coordinates in reverse order.
- The Directions widget now supports saving result route layers from a calculate directions request.
- Vector basemaps have been updated to work with the latest beta version. For more information see the Updates to Esri Vector Basemaps Released (Beta 2) blog article.
- An updated version of attribution guidelines has been documented to clarify questions about when to cite attribution of data.
- Two new locales: Croatian (hr) and Serbian (sr) have been added to the API and Web Optimizer.
- The ArcGIS API for JavaScript now uses Dojo version 1.11.1 (updated for version 3.17).
For more information on the details described in this blog post, see the What’s new in Version 3.17 guide topic. If you are attending the Esri User Conference June 27 – July 1 in San Diego, California stop by the Esri Showcase Web Developer Island to meet members of the JavaScript team and be sure to check out the JavaScript related sessions at UC.


Commenting is not enabled for this article.