At the plenary session of this year’s Esri User Conference, we demonstrated an integration of ArcGIS software with the latest innovations in deep learning to perform detection of swimming pools using aerial imagery. We then went a step further to identify pools in a state of neglect, which will empower health inspectors to help prevent the spread of vector-borne diseases.
Update (August 2021): We now have a pre-trained deep learning model for swimming pool detection! Read this blog to learn more about it.
Today, we’ll show you how we did it, and how ArcGIS made the process much easier. Our notebooks and script files are published here on GitHub; for complete methodology details, see our post on Medium.
The demo tackled two challenges facing the city of Redlands, California. Let’s take a closer look at them.
Challenge #1: Update assessor data
Tax assessors at local government agencies must often rely on expensive and infrequent surveys, leading to assessment inaccuracies. Swimming pools are an important part of assessment records because they impact the value of the property. Finding pools that are not on the assessment roll (such as those recently constructed) will be valuable to the assessor, and will ultimately mean additional revenue for the community.

Doing this through GIS and AI would certainly reduce the expensive human labor involved in updating the records through field visits of each property.
Challenge #2: Identify neglected pools
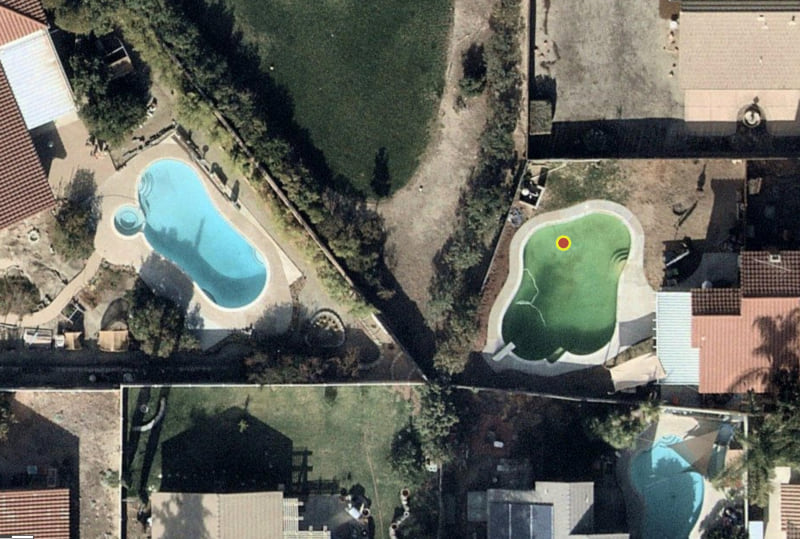
If a swimming pool is neglected, as when the property is foreclosed, it often turns a green color and becomes inviting to mosquitoes – standing water with no inputs or outputs. The sheer volume of properties affected in warmer climates, even as the market rebounded, has made the detection of these risky pools challenging for many organizations.
Public health and mosquito control agencies are tasked with protecting the public from vector-borne diseases, including viruses carried by mosquitoes like West Nile and Chikungunya. These agencies need a simple solution that helps them locate neglected pools from imagery and then use this intelligence to drive field activity and mitigation efforts.
Creating our training data
There’s a golden rule of deep learning: The more training data you give, the better the results. Deep learning models become powerful and accurate when they are fed huge quantities of data to learn from. To build our model, we needed to teach it what a swimming pool looks like from above, and then train it with a lot of imagery.
When we started, we couldn’t find an openly available labeled dataset for swimming pool detection using aerial imagery, so we labeled around 2,000 swimming pools in cities in southern California. Using ArcGIS Pro made the process faster.
In Pro, we have access to a host of aerial, satellite and drone imagery from Esri and its partners; we used the Esri World Imagery basemap for labeling. Pro includes a simple interface to label data, as well as advanced GIS functionality, including tools for reviewing data to manage its quality. ArcGIS Pro’s geoprocessing tools allowed us to create buffers and bounding boxes around labeled pool locations, and it includes the Export Training Data for Deep Learning tool, which creates the labeled image chips like the ones our model needed.

We created a shapefile containing the labeled pool locations using ArcGIS Pro and chipped out 224 px by 224 px images from the imagery using the locations in the shapefile. Our GitHub repository includes a notebook demonstrating this approach.
Choosing our imagery
When training a deep learning model, it’s important to use the most current and spatially accurate imagery. The image resolution at which you perform the training and inference and the imagery bands you use are also critical decision points.
The ArcGIS platform provides access to the Living Atlas of the World, which includes imagery from Landsat, Sentinel and NAIP (National Agriculture Imagery Program) satellites. High-resolution imagery is also available through Esri partners, including 7cm imagery from Nearmap and Vexcel.
NAIP imagery is acquired every two years during the growing seasons throughout the continental U.S. This imagery has a 1-meter resolution and comes in four bands – red, green, blue, and near-infrared. We chose NAIP imagery because it’s free for U.S. counties and states, and covers the whole “lower 48.”
Effectively distinguishing clean (healthy) and green (neglected) pools, on the other hand, requires a closer lens and more recent data. Nearmap and Vexcel imagery is collected much more often and provides a much higher resolution. We chose to use Nearmap imagery for our neglected-pool detection, as it’s included in the Esri World Imagery basemap for the area of Redlands.
Training the model
We used a Single Shot MultiBox Detector (SSD)-inspired architecture with focal loss to train our pool detector. Integration with deep learning libraries like PyTorch and fast.ai made this process fast and efficient.
For the imagery our model would use in training, we created chips from NAIP Color Infrared imagery. We were able to get decent results with around 2,000 chips, but the model made mistakes in detecting all pools. At this point, we recalled the golden rule!
We did heavy data augmentation by taking 50 random “jitters” of images around each pool location. Using this technique, we were able to convert those 2,000 images to 100,000 images. Upon training the complete model again, our validation tests were much more satisfactory.

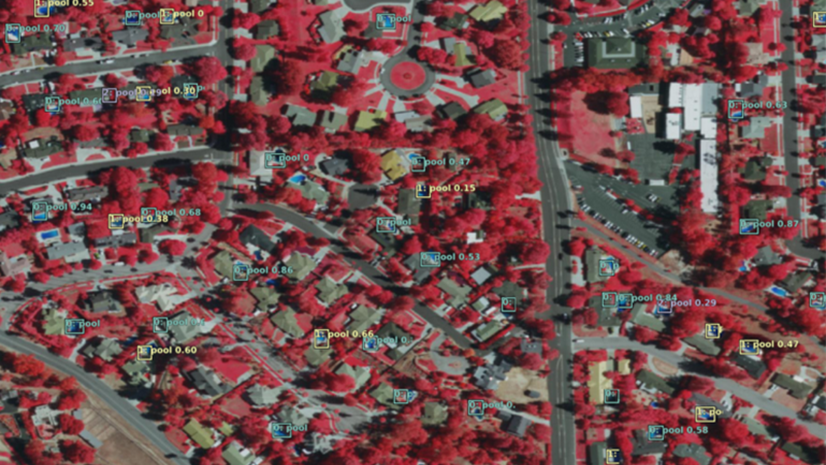
Once our model was fully trained and giving us good results, we tested it on a larger area of the NAIP imagery. We split the larger image into smaller chips, as the model requires. All these chips were simultaneously passed as a batch to the model, and its pool-detection predictions were gathered, combined and visualized in ArcGIS.
To run our model on the entire city, we used the capabilities of ArcGIS API for Python. We took the extent of the city of Redlands and exported NAIP images from that area. We then used the simple pipeline described above to collect predictions on all chips within each exported image, and converted them into a feature layer by transforming from image to geographic coordinates.
Identifying parcels with unassessed pools
With our pool-detection model ready, we applied it to solve our first challenge: identifying pools in Redlands that are not listed on their parcel’s tax assessment. The Join Features tool in ArcGIS Online helped us here.
We began with a feature layer of all Redlands parcels. The attribute table of that layer includes the pool_ field, which indicates whether the county assessor includes a swimming pool for a given parcel. Next, we added a feature layer with the results of our pool-detection model, and used Join Features to add the relevant parcel fields to that layer.
We then created a third feature layer with each parcel for which the pool_ field was empty, but within which our model had detected a pool.

This new layer identified nearly 600 new pools that were not marked correctly in the county database. ArcGIS Online then made it easy to visualize our results. You can explore this web map containing our three feature layers:
Clean or green?
Now that our model could accurately identify swimming pools from aerial imagery, we could tackle our second challenge – to label them as clean or green (neglected pools, sometimes also referred to as “zombie pools”). Green pools often contain algae and can be breeding grounds for mosquitoes and other insects. Mosquito control agencies need a simple solution that helps them locate such pools and drive field activity and mitigation efforts.

We trained our model using recent high-resolution Nearmap imagery (7 cm resolution) and a large data set of manually labeled clean or green pools. As before, we took multiple “jittered” images of each green pool to increase the number of training images the network could study.
Once the model was ready to distinguish clean and green pools, we ran the inference pipeline on our Redlands city imagery. Take a look at this web map, which shows zombie pools potentially at risk of being mosquito breeding grounds!

We are seeing excellent results as we integrate AI techniques into the ArcGIS platform. This includes machine learning and deep learning algorithms that can do automated object detection, classification and extraction ... delivering a highly accurate model that can facilitate deeper analysis and predict precise outcomes, at minimal cost.
The benefits of ArcGIS integration
A primary goal of this project was to apply the latest research in deep learning and use it to solve real-world problems, be it to update county records or to assist mosquito abatement drives. The ArcGIS platform includes a host of capabilities – online mapping, big data analysis, collaboration, and field mobility – to help achieve these goals.
Once we had obtained the locations of the detected swimming pools, it was easy to use the analysis tools in ArcGIS Online to identify parcels that were not being accessed correctly. The Spatial DataFrame in ArcGIS API for Python enabled us to generate Pythonic reports of such properties, and to create information products such as GIS layers to be visualized in web maps or used for further analysis.
The API’s map widget for Jupyter notebooks allowed us to visualize detected pools and residential parcels, and provided renderers and symbology to make it easy to understand the generated maps. The maps could then be saved as web maps and shared with collaborators.
Esri has also recently introduced (as beta) an Image Visit configurable app template that lets image analysts visually inspect the results of an object detection workflow and categorize each as either a correct or an incorrect detection. A live demo of the configured web app is here. This information could then also be fed into better training or to filter the results and prioritize field activities.

We could then use the field mobility capabilities of the ArcGIS platform. Workforce for ArcGIS allows for creation of assignments for mobile workers, such as inspectors in mosquito control agencies. We used the recently introduced apps module in ArcGIS API for Python to automate creation of Workforce assignments for mosquito-control field workers based on the results of the neglected pool detection analysis.

We have only scratched the surface of what’s possible. This is just one application of GIS and AI integration – there are countless others waiting to be powered by these amazing technologies. Stay tuned for more exciting stuff coming out soon!
This post was written with Divyansh Jha, a deep learning intern in our New Delhi office.

Article Discussion: