By Aileen Buckley, Esri Research Cartographer
The United States Geological Survey (USGS), with the help of Esri, has posted almost 186,000 topographic maps from its national map series online. You can view these maps in an app called USGS Historical Topographic Map Explorer. You can also add images of the maps to your project in ArcMap, then use the images to digitize features, make measurements, or perform other operations.
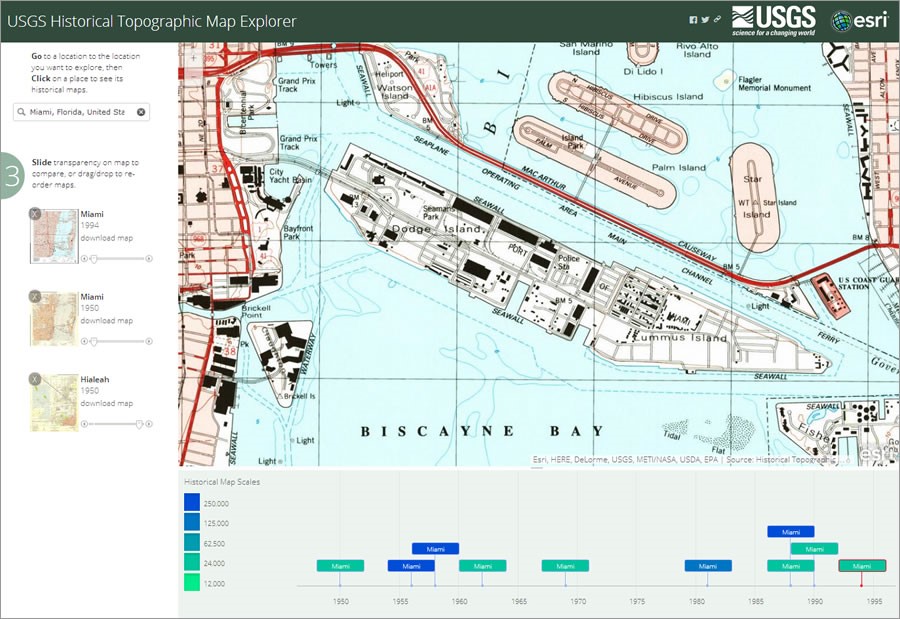
The USGS Historical Topographic Map Explorer
The U.S. Geological Survey, America’s national mapping agency, started scanning its maps years ago and it continues to scan and georeference its historical USGS topographic maps. “The Historical Quadrangle Scanning Project (HQSP) is scanning all scales and all editions of approximately 250,000 topographic maps published by the USGS since the inception of the topographic mapping program in 1884. This scanning will provide a comprehensive digital repository of USGS topographic maps, available to the public at no cost. This project serves the dual purpose of creating a master catalog and digital archive copies of the irreplaceable collection of topographic maps in the USGS Reston Map Library as well as making the maps available for viewing and downloading from the USGS…”
A collaborative effort with Esri allowed the maps to be organized into a collection that could be shared as map services so they can be viewed on the web. This effort resulted in the development of a workflow for converting map collections to a format that can be shared online. That workflow and additional resources (custom script tools and sample data and .mxds) are being made available to all on ArcGIS Online. In the workflow, we explain the processes for scanning, georeferencing, and building metadata for the maps. Then we explain how the scanned map images are used to create image services accessible from the web. Finally, we explain how to use a configurable template, freely accessed on GitHub, to produce a web map app custom tailored to fit other collections.
To better appreciate the value of the historical topographic maps in the collection, it might help to see some examples. Here are just two places with historical maps that tell interesting stories of the past.
The first is Mount Saint Helens in Washington State. The area around Mount Saint Helens changed dramatically after erupting on May 18, 1980. It was the deadliest eruption in United States history and the costliest. Prior to the eruption, Mount Saint Helens had a conical dome, which is indicated by the circular pattern of contour lines on the 1958 1:24,000-scale map. Note that the summit was 9,677 feet high. At that time, the dome was largely covered by glaciers.
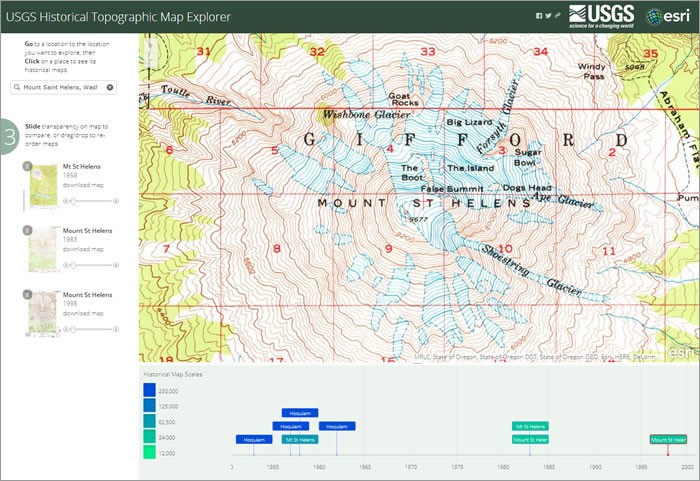
Mount Saint Helens, 1958, 1:24,000
The 1983 1:24,000-scale map showed the mountain after the eruption. Volcanic activity had been building for weeks, causing a bulge on the northern flank of the mountain. On May 18, 1980, a magnitude 5.1 earthquake triggered a series of volcanic blasts that caused the bulge to fail, producing the largest debris avalanche in recorded history and devastating the area to the north. The extent of the mountain’s glaciers, shown outlined in blue on the map, had decreased dramatically.
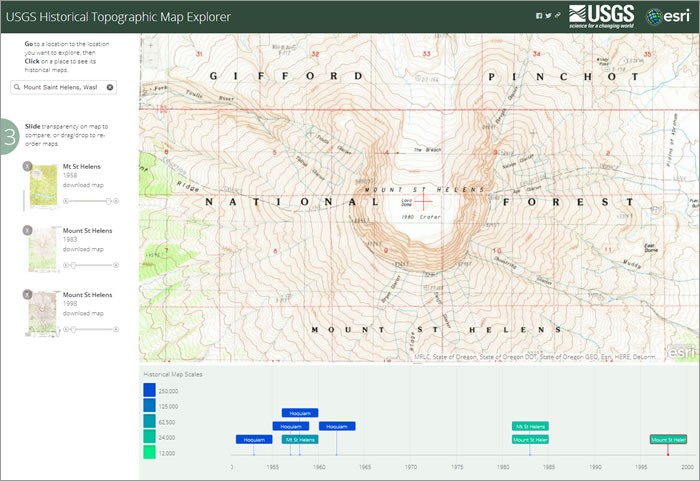
Mount Saint Helens, 1983, 1:24,000
On the 1998 1:24,000-scale map, you can see that the summit was 7,152 feet high, a decrease of over 2,500 feet since 1958. The map below also shows that the rim of the crater is steeper than in 1958, as evidenced by the more closely spaced contour lines. It also shows additional decrease in the extent of the glaciers. What it does not show, however, is Crater Glacier, which is located inside the dome in the flatter area between the steep rim and the lava dome. The volume of ice in this glacier, which has accumulated since 1980, is about the same as the total for all pre-1980 glaciers combined.
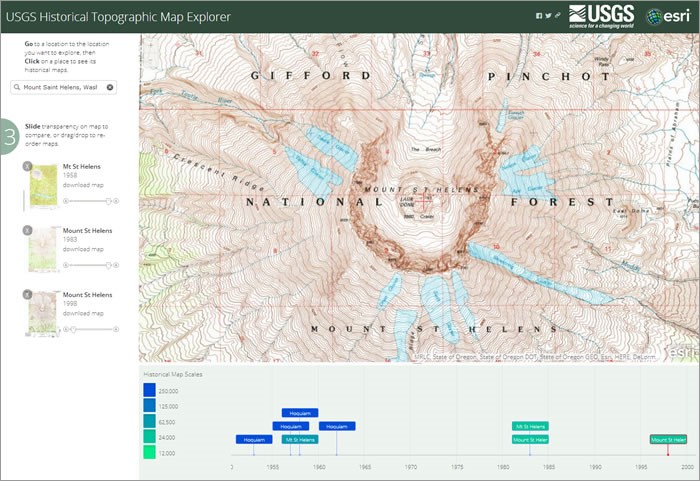
Mount Saint Helens, 1998, 1:24,000
The next example shows the interesting history of Coronado, an island across the bay from San Diego, California.
The 1904 1:62,000-scale map of San Diego shows the resort town of Coronado, founded in 1885. It also shows the Hotel del Coronado, which was completed in 1888. Across Spanish Bight, North Island had not yet been developed.
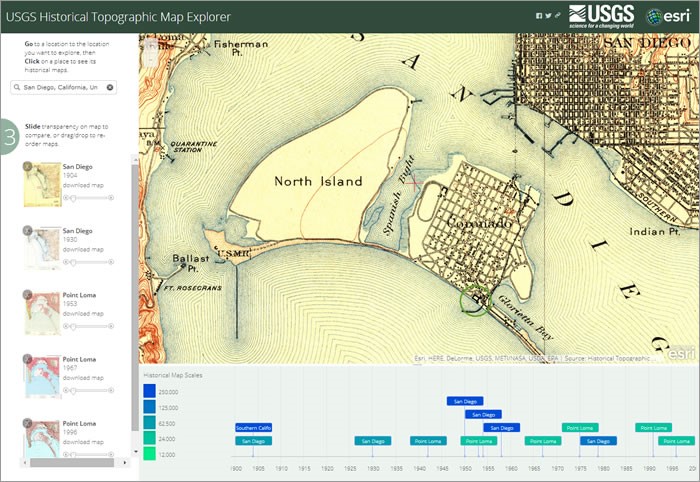
San Diego, 1904, 1:62,000
The 1930 1:62,000-scale map of San Diego shows the development of the US naval station and aviation fields on North Island. Also, the area just south of Hotel del Coronado shows a number of tightly packed buildings. This was known as Tent City, a tourist/vacation area where the original tents were gradually replaced with cottages. Tent City was torn down in the early 1940s.
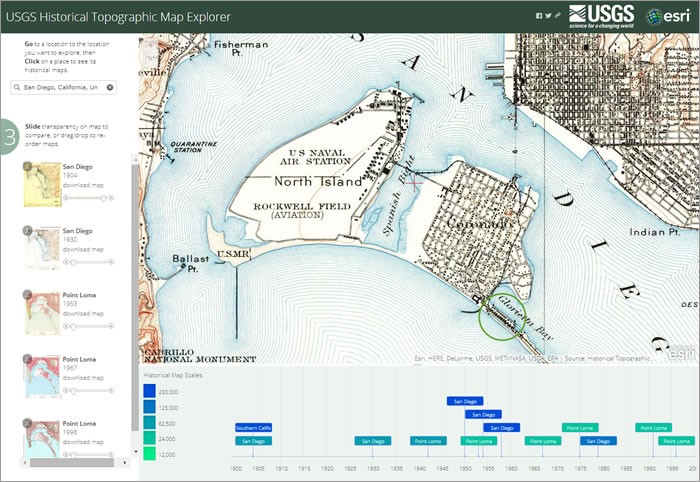
San Diego, 1930, 1:62,000
On the 1953 1:24,000-scale map, Spanish Bight is no longer shown. This area was landfilled in 1944 to provide more land for the naval base.
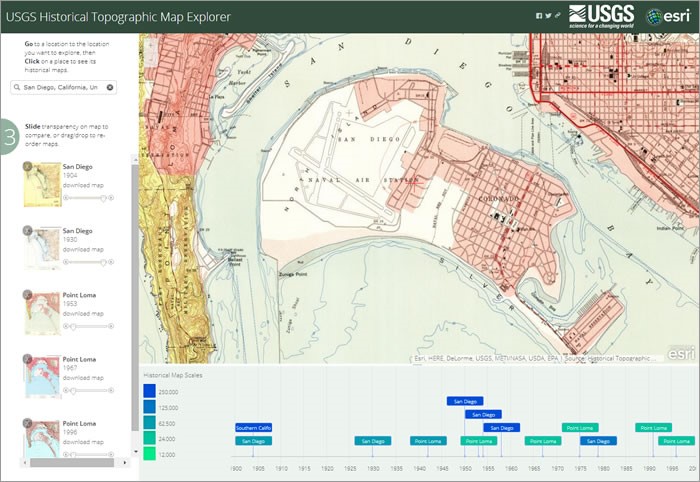
Point Loma, 1953, 1:24,000
The 1967 1:24,000-scale map shows Coronado Bridge, which was probably still under construction, as it wasn’t officially opened to the public until 1969.
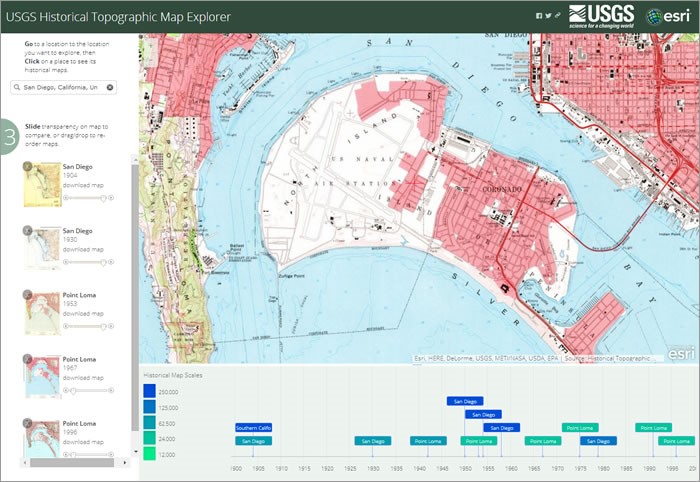
Point Loma, 1967, 1:24,000
Stories such as these are easy to find once you start exploring. The USGS Historical Topographic Map Explorer helps you to find them, in the process, capturing your imagination and revealing the past. These maps can also help you analyze and understand historical changes in ArcMap where you have access to the full power of the ArcGIS Platform.
To learn more about the joint project, see the New York to LA: History of America’s Maps in One App and Historical Topographic Maps – Preserving the Past news items.
To learn more about using the web app, see the Envisioning the Past: Tips on How to Use the USGS Historical Topographic Map Explorer ArcWatch article and the Go Deeper with Historical USGS Historical Maps Explorationblog entry.
To learn more about the HQSP, see the USGS Historical Quadrangle Scanning Project and 175,000 U.S. Historical Maps-Now Online blog entries.


Article Discussion: