Interpreting and analyzing climate data is an essential part of the process to build climate-resilient communities. However, not all climate data is of the highest quality, and as GIS professionals, you shouldn’t have to waste time sorting through lots of models to find valid and relevant data. New, highly accurate climate models now available in ArcGIS Living Atlas facilitate a wide variety of climate analyses without the need to track down and process large amounts of data.
Studying changes in climate may seem straightforward to any GIS professional at the start; however, once you are faced with several emissions scenarios, dozens of different climate models, hundreds of variables, terabytes of data, the task quickly becomes daunting.
ArcGIS Living Atlas set out to demystify and simplify the process of climate analysis with a new suite of multidimensional climate data.
Before we get into the details of the data available in Living Atlas, let’s go over some basics of climate data in general:
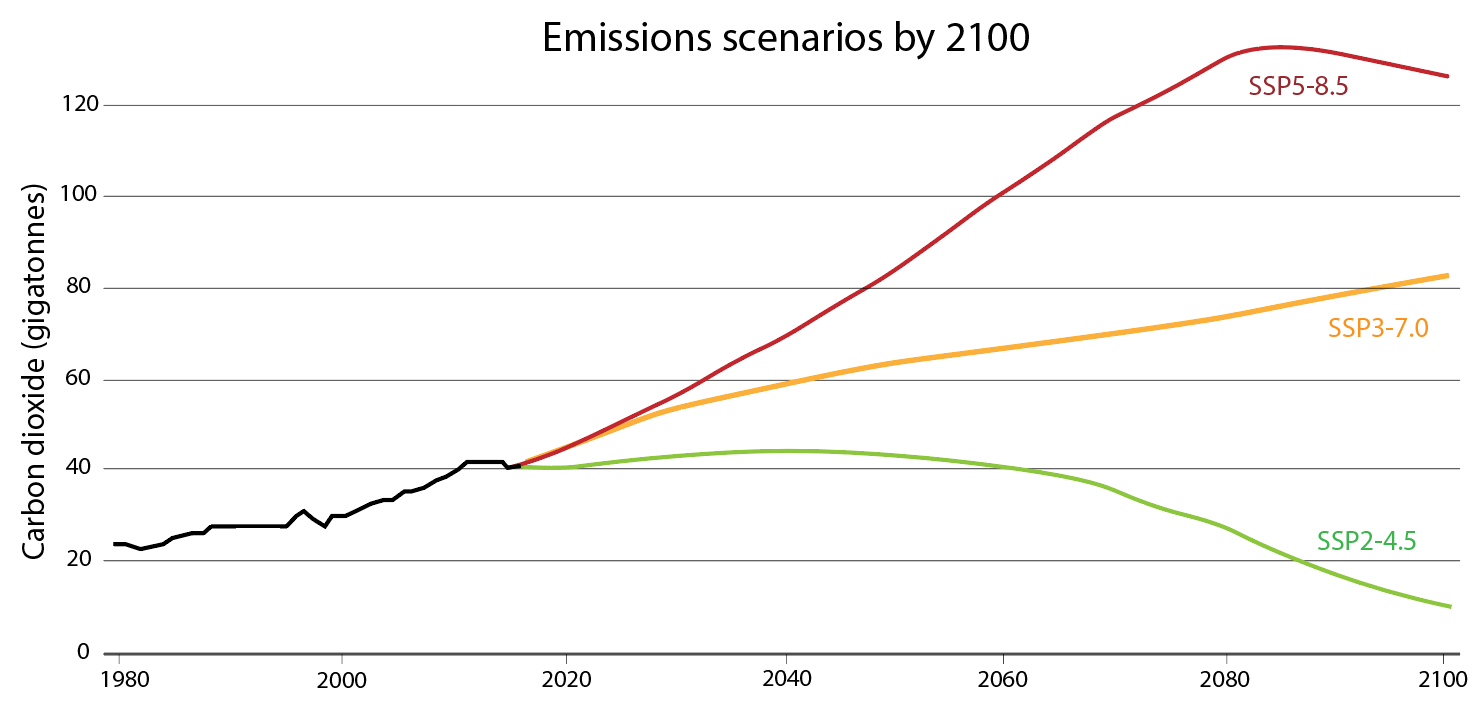
Most climate analysis consists of comparing baseline conditions against conditions within some future climate scenario at a future date. Therefore, all climate data in Living Atlas come with baseline or “historical” conditions and conditions for future scenarios and decades. Future climate scenarios include both future decades (2050, 2090) and future emissions scenarios that represent different paths humans take to reduce emissions in terms of speed and scale of emissions reduction. These scenarios, based on a range of socioeconomic decisions, are called “Shared Socioeconomic Pathways” (SSPs) and replace the term “Representative Concentration Pathways” (RCPs) used in earlier climate models. SSPs’ emissions range from optimistic (quick and intense reduction of emissions) to more terrifying (“business as usual” or no significant push to decrease emissions). SSP2-4.5 is generally considered the target if 2021 UN COP26 emissions goals are met.
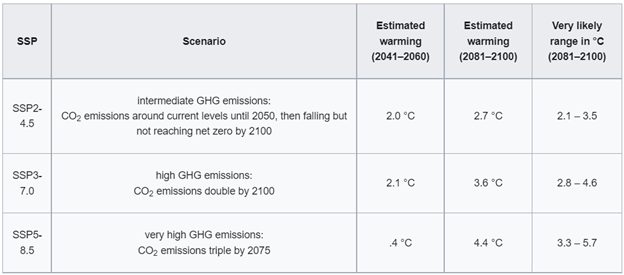
Within either timeframe, though, there are also several variables. A variable may be something like “mean daily temperature” or “number of days over 100 ºF” and values will usually be at least slightly different in historical and future climate scenarios. Lastly, there are dozens of different organizations and initiatives producing slightly different climate models. No one model is perfect, and some are better than others at predicting events like extreme temperature or spatial patterns of precipitation. Therefore, it is common practice to create ensemble models that average multiple models together to reduce error. Methods of weighing and averaging ensembles differ (more on this later).
Now with a little background information established, let’s get into the two main types of data available within Living Atlas…
WorldClim
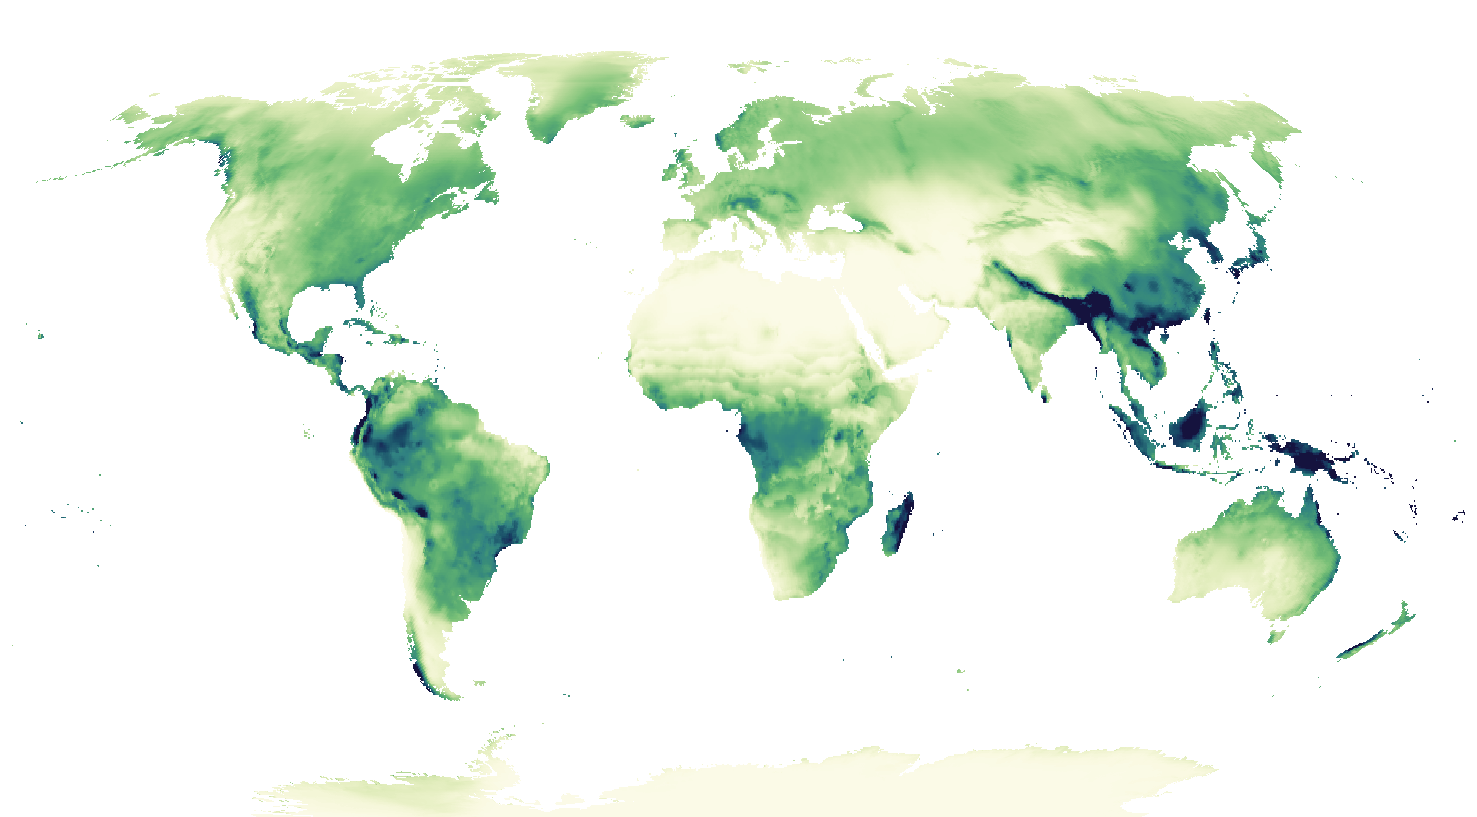
For global climate analysis, the Living Atlas has recently made available 19 bioclimatic variables from WorldClim using the United Nations CMIP6 data. The release of CMIP6 data corresponds with the latest Intergovernmental Panel on Climate Change (IPCC) assessment report published in late 2021. CMIP6 features state-of-the-art climate models more advanced and accurate than those released with CMIP5 nearly a decade ago. Data is available for the entire world at 2.5 minute resolution (approximately 5-km), and climate projections exist in a range of future timeframes (2021-2040, 2041-2060, 2061-2080, and 2081-2100) and emissions scenarios (SSP2-4.5, SSP3-7.0, and SSP5-8.5). A historic baseline average from 1970-2000 is available in Living Atlas for comparison.
While WorldClim provides data for 24 different global climate models, the data available in Living Atlas is based on an ensemble of 13 different models (Mahoney et al. 2022). Each variable is averaged with equal weight to create this ensemble. Of the 19 bioclimatic variables, 11 are related to temperature averages (i.e. “Mean Temperature of the Driest Quarter”), extremes (“Max Temperature of the Warmest Month”), or other temperature variables (“Temperature Seasonality”). The remaining variables are devoted to precipitation totals by year, month, and quarter, and precipitation seasonality. The purpose of the bioclimatic data is to provide a complete, holistic picture of the bioclimate for use in bioclimatic modeling and predictions.
U.S. Climate Thresholds from LOCA –
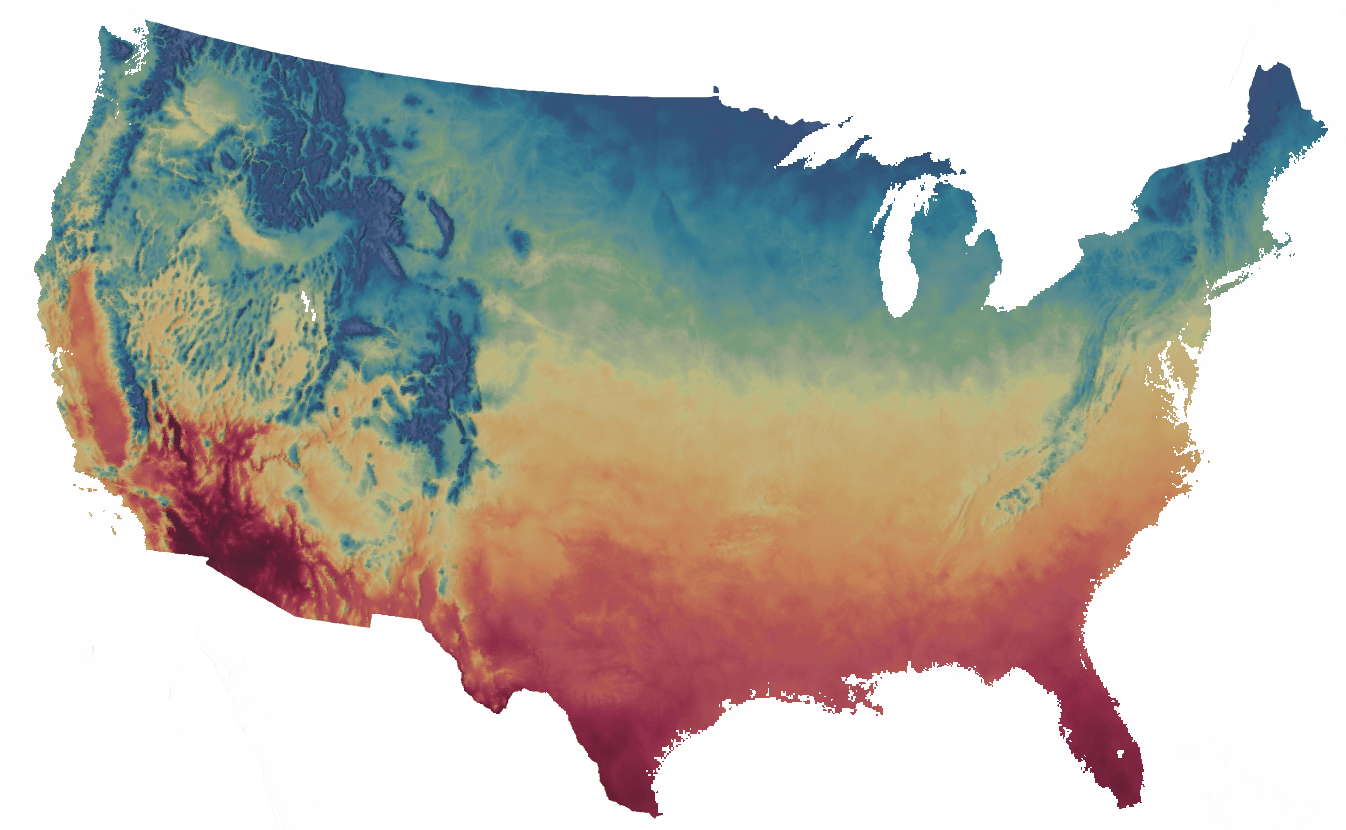
The second suite of climate data in Living Atlas is a set of U.S.- specific variables based on the United States 4th National Climate Assessment from 2018. Projections for changes in temperature and precipitation were derived from the LOCA downscaled climate model ensembles processed by NOAA at around 6.5-km resolution. The U.S. LOCA data is an ensemble of 32 different models specifically tailored to the United States climate and optimally weighted to best match historic climate observation. While WorldClim data focus on temperature and precipitation averages and totals, this LOCA data instead focuses on 47 “decision-ready” variables. These variables are more like thresholds that explore climate exposure and extreme events. The include, for example, annual estimates of days with temperatures exceeding 90/95/100 °F, maximum 1-day precipitation, consecutive dry days, and cooling degree days.
The U.S. Climate (LOCA) data is available for the moderate (RCP 4.5) and very high (RCP 8.5) emissions scenarios and for early (2030), mid (2050), and late-century (2085) timeframes. These future climate predictions may be compared against the historic (1976-2005) baseline values for the same variables.
So what dataset should I use?
Both climate datasets are great, but each is specifically suited to different use cases. When deciding which dataset to use, ask yourself the following questions:
What is my study area?
For most analysis in the U.S., LOCA data should be used. LOCA data has been specifically optimized to historic U.S. climate conditions, so it is more accurate than WorldClim for within the United States. LOCA data, however, does not cover anywhere outside of the latitudinal bounds of the contiguous U.S. (LOCA includes some bordering areas of Canada and Mexico), so for non-US modeling or modeling within Hawaii or Alaska, WorldClim data must be used and is still highly accurate given that WorldClim data is based on just-released CMIP6 models.
What am I trying to study?
LOCA and WorldClim variables differ significantly. WorldClim variables focus on temperature and precipitation averages and totals, so this is ideal for bioclimatic assessments and suitability modeling – anything that relies on a complete picture of climatic conditions. For example, the USGS has specifically used these 19 bioclimatic variables for studying the suitable conditions for species physiology.
LOCA data, on the other hand, focuses on number of days beyond certain thresholds (annual days over 90 °F, consecutive wet days, last freeze day). The focus of LOCA is therefore to support decision-making related to climate exposure for things like extreme heat, prolonged drought, etc. The decision-ready nature of the LOCA data means it is geared less toward species suitability and more toward policy, climate resilience, and adaptation.
How do I get started?
Both the WorldClim and LOCA datasets come as multidimensional rasters. Working with multidimensional datasets may be intimidating at first, but once you know how to use the proper multidimensional tools, it becomes much less daunting.
Multidimensional climate data consists of different dimensions of variables, years, and emissions scenarios. For WorldClim data, each layer is a different variable and within each layer, the dimensions are emissions scenario and year. For LOCA, there are separate layers for each year range and emissions scenario, and the dimensions within the data are the 47 different variables.
Working in ArcGIS Online
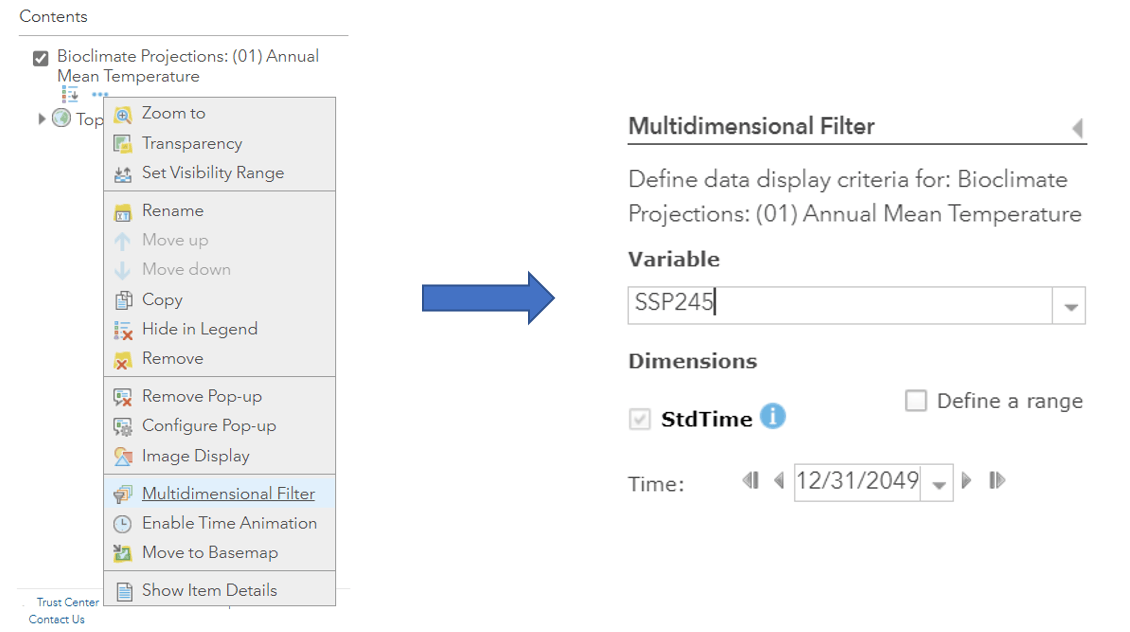
To quickly view and compare differences in climate between decades and emissions scenarios, you can open the WorldClim or LOCA data within ArcGIS Online in Map Viewer Classic. Within your layer of interest, select the multidimensional filter from the drop down menu. The filter gives you the ability to select the emissions scenario and a year or date range. Select an emissions scenario and year and click apply to view your filtered subset of the multidimensional layer.
Working in ArcGIS Pro
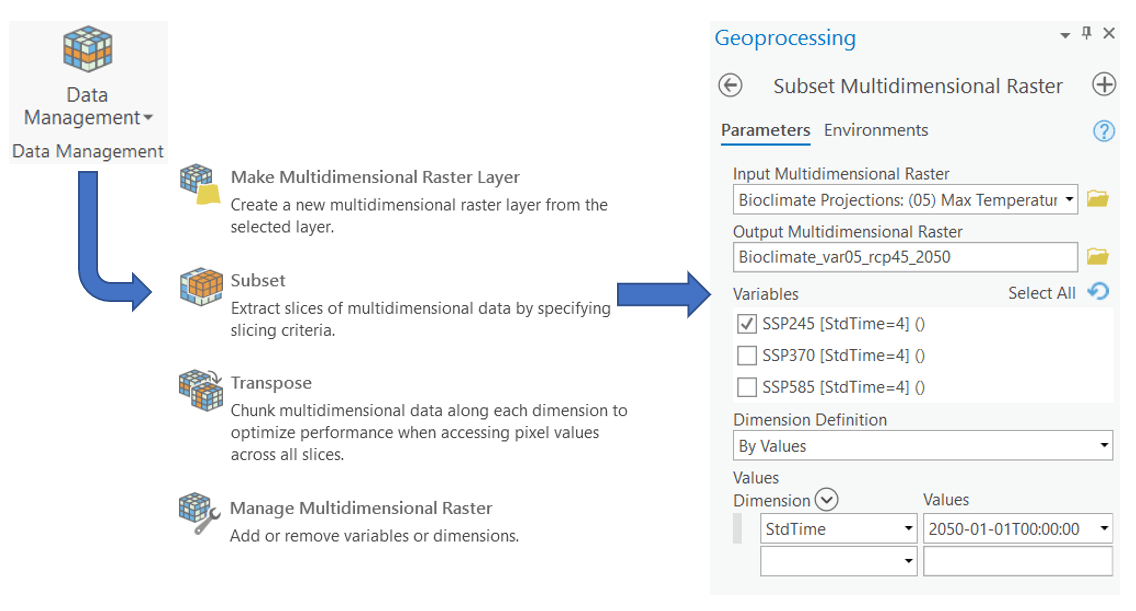
Working with the multidimensional data in ArcGIS Pro gives you a bit more functionality for analysis. In most cases, you will want to subset the multidimensional rasters so that you are only working with one dimension (one year, one emissions scenario, one variable). Subsetting is an easy process, and it is the surest way to extract only one dimension without accidently averaging multiple years or emissions scenarios together. The subset tool can be found within the multidimensional toolbar under data management.
See the example below to subset the WorldClim data to one emissions scenario (SSP2-4.5) and one year (2050). Selecting “by values” as the dimensional definition is the ideal way to subset one dimension of time. The resulting raster will not be multidimensional and will only contain data for your selected subset.
With your data subset to your emissions scenario and year, you are now ready to get started on further analysis.
These new additions to Living Atlas provide authoritative, high resolution climate models to be used for a variety of social and ecological problems – or just to better understand our changing climate. With easy access to the most up-to-date climate data, users are empowered to conduct robust scientific analysis and inquiry in the ease of web and desktop environments.


Article Discussion: