2020 was the second hottest year* on record according to NOAA.
All of the top ten warmest years on record since the late 1800s have occurred since 2005. The top five have all been since 2015. Every year since 1977 has been warmer than the 20th Century average. You get the idea.
Want to explore this data for yourself? Now you can by using Living Atlas of the World.

Three new feature layers are available from the NOAAGlobalTemp dataset: the latest monthly temperature analysis, the full monthly archive from 1880 – present, and the annual average from 1880 – present. All of them compare the observed temperature to the 1971-2000 base period** (so -2oC means 2o cooler than the 1971-2000 average).
While relatively coarse in resolution (5×5 degrees), the data can help identify regional patterns in temperature trends, such as comparing global to Arctic temperatures.

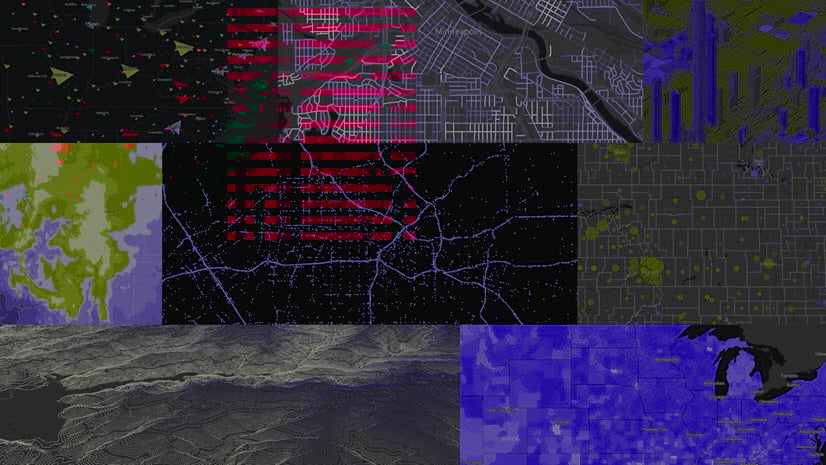
Using tools like the Space Time Pattern Mining Tools, we can identify trends and emerging hot spots (hint: almost everywhere has a warming trend or a hot spot). And charting tools in ArcGIS Pro allow you to analyze different time ranges (monthly, annual, decadal, etc.) or spatial regions.
Climate Risk Analysis Using ArcGIS
Data like NOAA’s global temperature anomalies confirm the scale and intensity of global climate change. But the power of GIS is not just in the spatial analysis of a single dataset, it’s the layering of multiple and disparate data and information products that can guide our decisions to plan for, mitigate, and ameliorate the impacts of climate change.
It is no surprise that ArcGIS has been ranked as the premier platform for assessing climate risk impacts. Why? Not only does ArcGIS simplify access to authoritative data through Living Atlas, but ArcGIS simplifies workflows, making decision support faster, clearer, and more broadly consumable. These capabilities will become even more important as the U.S. government rejoins the global efforts to mitigate climate change in partnership with state/local governments, academia, and the private sector.

Learn to Apply Location Intelligence to Climate
We are actively building more and more capabilities into ArcGIS that support the analysis of climate data and to understand climate change impacts. There are a variety of resources available in Learn ArcGIS, along with a series of training webinars available from Esri staff and our partners in climate science, and an upcoming series sponsored by the American Meteorological Society (with yours truly) that will not only teach analysis in ArcGIS Pro, but also ArcGIS Notebooks, which will undoubtedly open up GIS to climate scientists.
Esri is building a broad community of climate scientists and practitioners. Read more about them on our Esri Sciences page.
*Several different organizations including NOAA, NASA, UK Met Office, and Copernicus derive their own global statistics. Some ranked 2020 as tied with 2016 for the warmest year on record.
**Paying attention to the base period for any climate dataset is critical. Statistics are reported as compared to the 20th Century average. Many datasets use the 1981-2010 base period. The World Meteorological Standard for global temperature is a relic 1971-2000. This year, many organizations will update to a 1991-2020 base period, as it is the most recent completed 3-decade period of record. Its very confusing, I know.


Article Discussion: