Its fire season here in California! (Actually, a recent New York Times article quotes the deputy chief of CalFire as saying that it is always fire season in California.) Whether you live in The Golden State or not, there are a variety of resources available in the Living Atlas to map, analyze, and understand wildfires and fire risk in the U.S. and across the world.
Many Earth-observing satellites contain sensors capable of detecting the infrared energy released by fires. Not only can the hotspots be located, but areas of burned land can also be identified based both on their thermal characteristics and visible appearance. Along with intelligence on the ground, these data are used to plot the location and spread of fires around the world.
Pinpointing Potential Fires
The most basic fire data are the locations of hotspots and typically come from geostationary and polar-orbiting satellite with frequent revisit times (i.e., less than a day), such as the NOAA GOES, NOAA-20, or NASA Aqua and Terra satellites. These data are a count of thermal pixels. But many things can generate a hotspot, including controlled burns, oil and gas rigs, volcanoes, etc. This kind of data must be used with some caution since there are many features that are not wildfires. However, it is still extremely useful at monitoring known fire events or fire-prone areas.
In the Living Atlas, the MODIS Thermal Activity layer provides daily updated global hotspot locations. Data from two NASA satellites are combined in this layer: Aqua (“A” in the table) and Terra (“T”). Each can be filtered or queried in ArcGIS Online or Desktop. Since Aqua is in the “afternoon orbit,” when wildfires are typically at their peak, I prefer to use this source since it reduces the number of redundant features – the two satellite orbits are only 3-hours apart.

This map shows the Aqua thermal activity data, using the newly released Firefly symbology in ArcGIS Online. I use the Counts and Amounts option with the FRP (Fire Radiative Power) attribute, which measures the energy released by each hotspot. Notice the “false positives” in Kuwait associated with the flames atop oil wells.
Want to use Firefly in ArcGIS Pro? Check this out.
U.S. Active Fire Data
In the U.S., the USA WIldfire Activity layer provides a more quality controlled version of the data. It shows only wildfires submitted to the USGS by fire agencies, as opposed to all of the other events that can cause an automated satellite-based hotspot detection. However, since this layer relies on human analysis, sometimes it doesn’t update as frequently as the MODIS hotspots. The layer also contains the perimeter of the fire area, which IMHO is the most interesting feature. Both current (active) and older (inactive) fires are included.
But why not combine the best attributes of both datasets?

In this map, the Firefly effect is used on the % Contained attribute in the Active Fire Report layer. Fires that are less contained are larger and colored more intensely. While the Active Perimeter layer displays at all scales, the Active Fire Report layer uses the Set Visibility Range option. It disappears at closer scales and the MODIS Thermal Activity layer appears, again using the FRP attribute.
Peering Through the Clouds
While the weather-focused satellites from NOAA and NASA provide high temporal resolution fire data, really detailed analysis of the fire impact is often left to moderate resolution multispectral imaging satellites such as Landsat 8 and Sentinel-2, or commercial high-resolution satellites.
Here we can see the benefits of the multispectral capabilities of the Sentinel-2 satellite, now available in the Living Atlas.
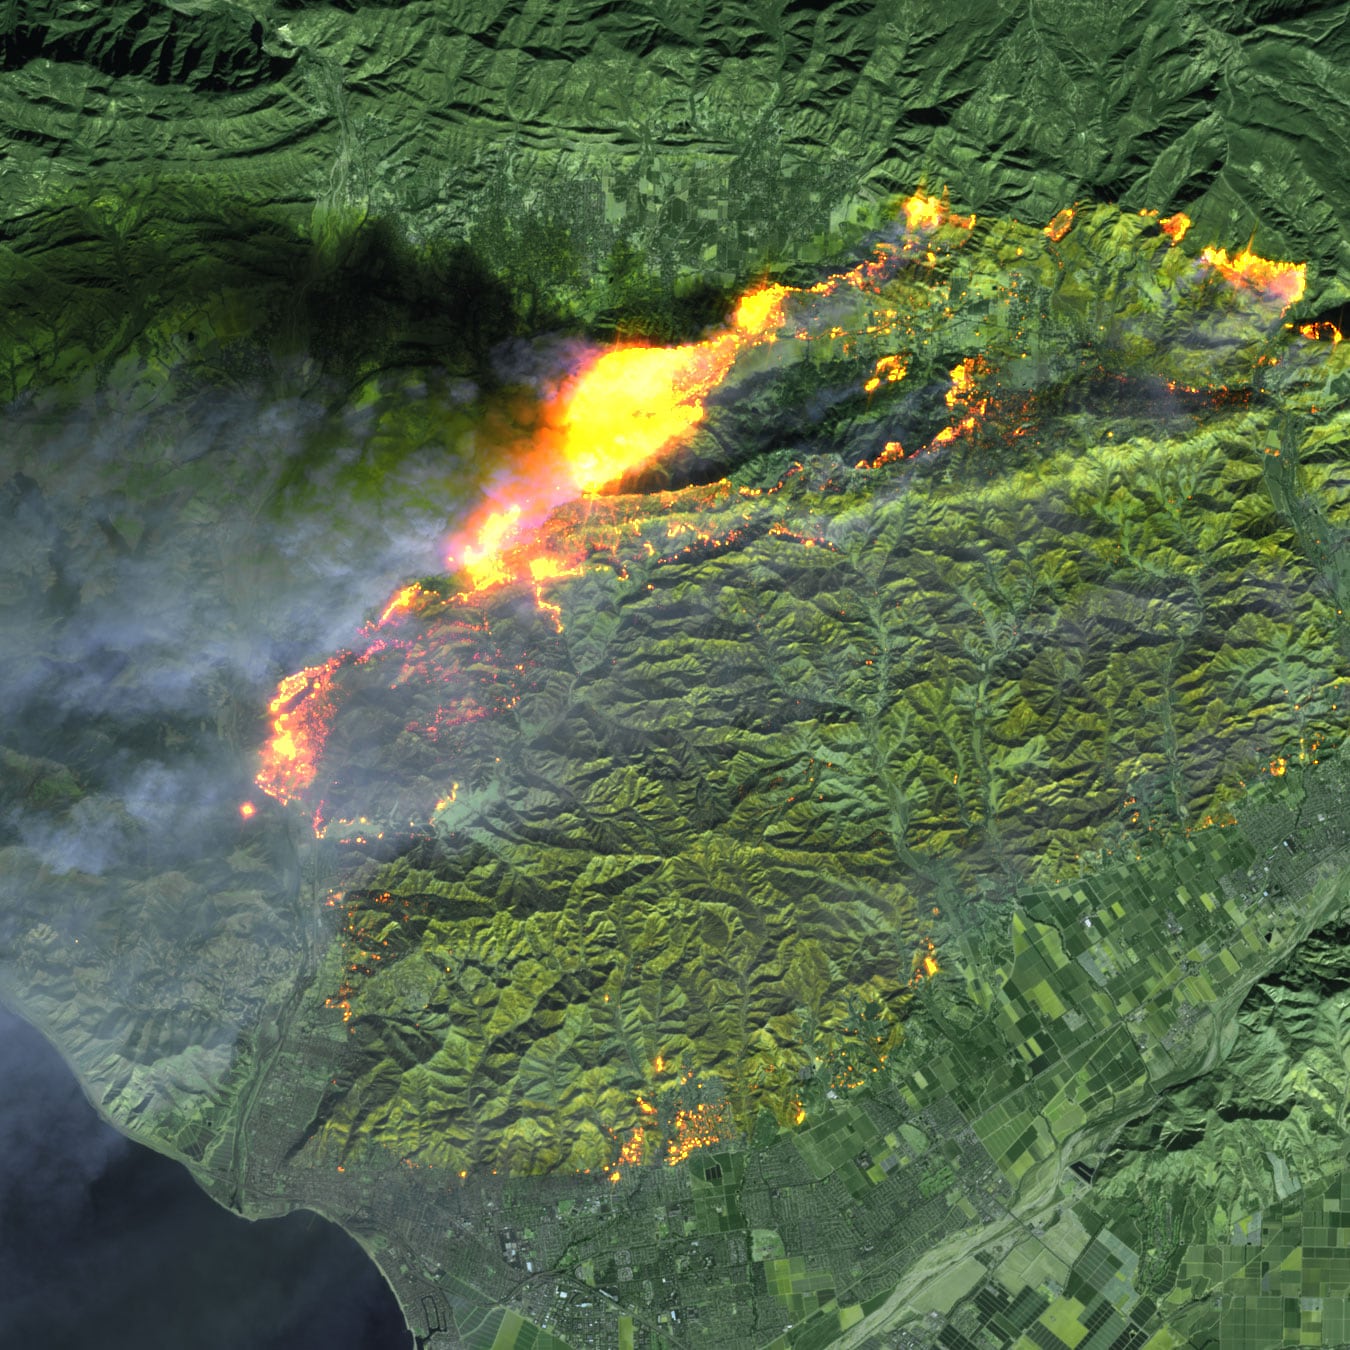
Sentinel-2’s infrared sensitivity (Channel 12; 2.19 micron band) provides the ability to identify areas of active fires, much like NOAA-20 or Aqua/Terra, but at 20m resolution. If you’re using the Sentinel-2 Views layer in ArcGIS Online, go into the Image Display options. Pull down the Render options and select Short-wave Infrared with DRA. This particular RGB combination relies more on thermal than visible channels, penetrating through clouds to see active fire areas. The Short-wave Infrared RGB combination is also available in the Sentinel Explorer app.
In addition to visualizing active fire areas, multispectral imagery is also effective at assessing burn scars. Besides the ecosystem impact, denuded vegetation along sloped areas can lead to landslides, especially when combined with heavy rains.
Smoke Impacts
The flames of an intense fire span across a few dozen miles, but the smoke emitted from a fire can seriously affect the air quality of areas hundreds of miles downwind. NOAA’s smoke forecast models rely on understanding both the vegetation of an area along with the heat/energy of a fire – which is where the Fire Radiative Power (FRP) attribute from above comes in again. Higher temperatures or FRP can burn more types of materials, creating more smoke.

In the Living Atlas, the National Weather Service Smoke Forecast layer can be merged with any of the fire location layers, or other forecast data such as wind speeds. In fact, check out this blog and app from Michael Dangermond to see an example.
New, Now and Next
The Living Atlas team is currently working on a few updates to our data layers.
- Adding the VIIRS thermal activity data.
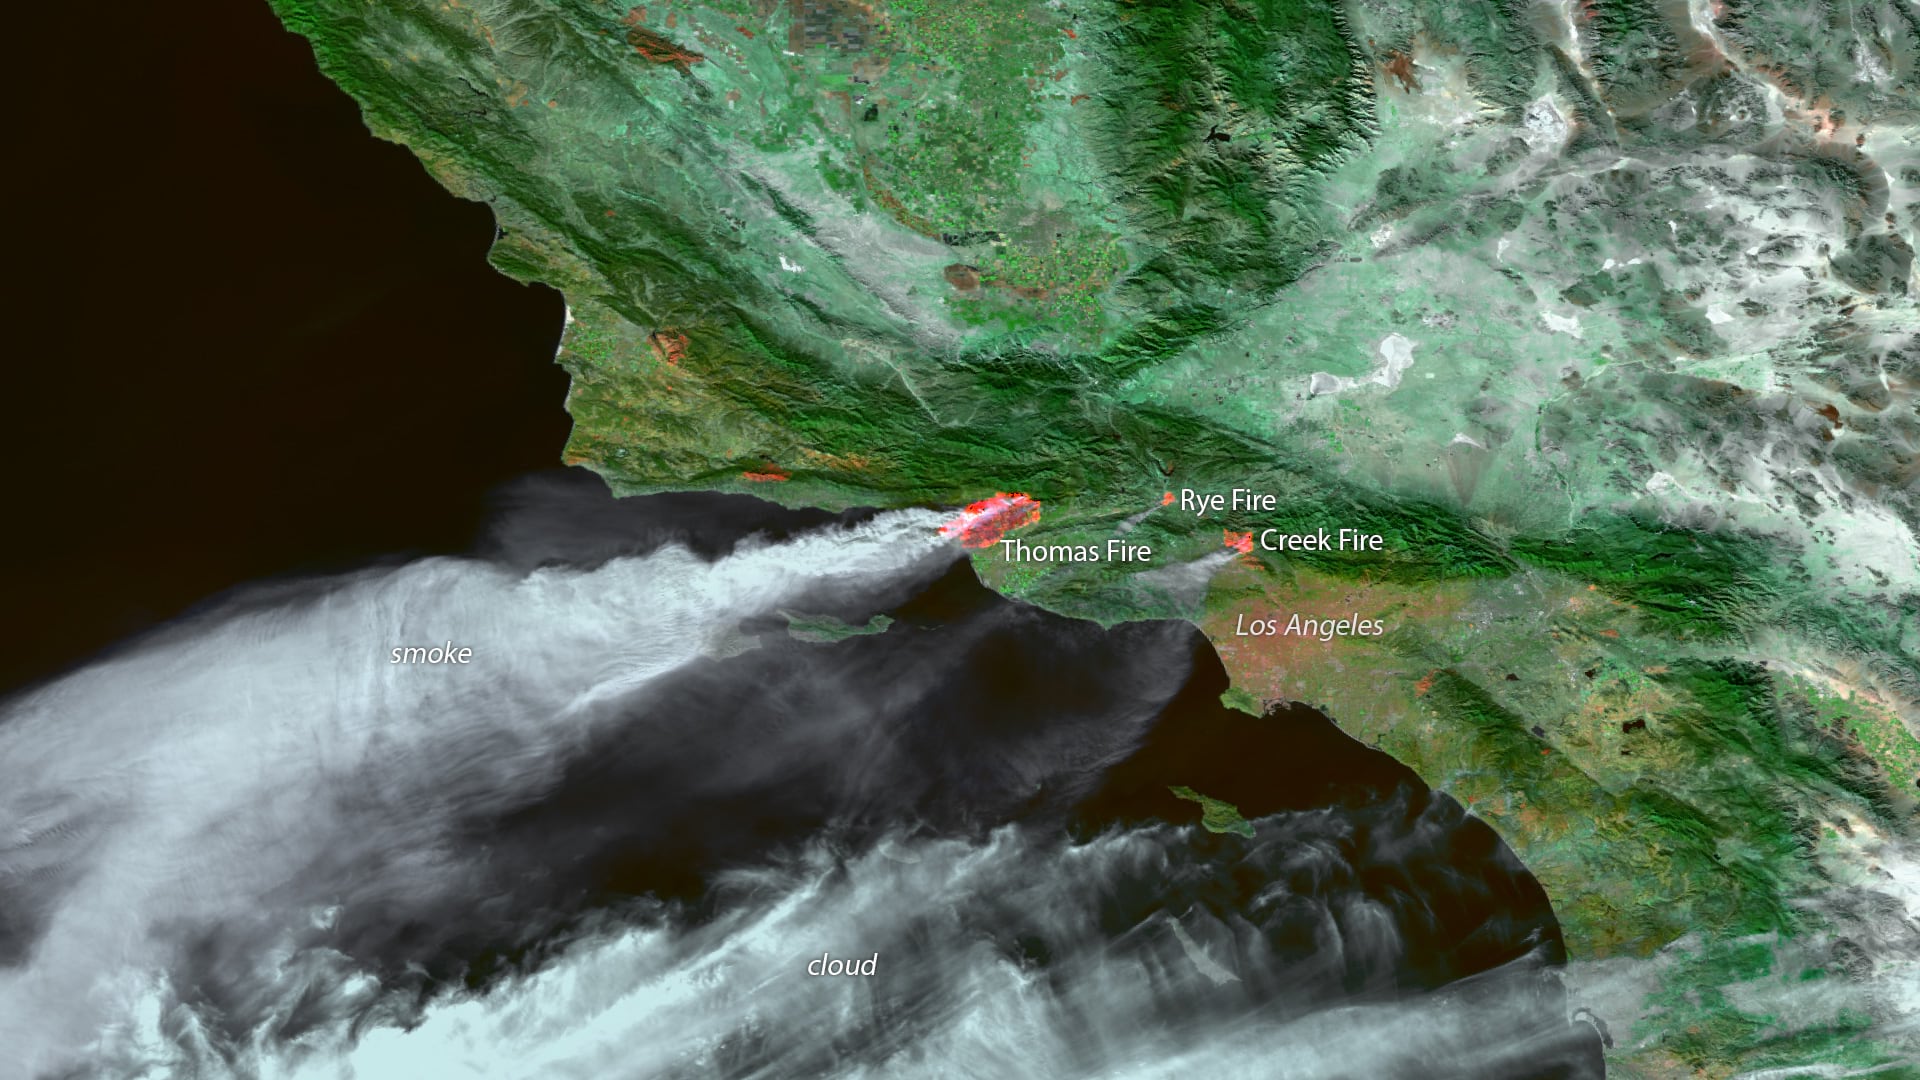
The VIIRS sensor is the more modern version of MODIS, and is flown on NOAA’s latest polar-orbiting satellites. The sensor is a huge improvement over MODIS, providing 375m per pixel resolution, and it has multiple channels that can detect fires. By comparison, the thermal channels on MODIS are around 1km per pixel. You can see the improvement in this swipe app I built to compare the data from MODIS with VIIRS for the first day of the Thomas Fire that occurred outside Los Angeles in 2017.

- Improvements to the Smoke Forecast
We will be updating many of the Live Feeds datasets, including the National Weather Service Smoke Forecast. Besides improving some of the data classifications, we’ll also be adding in the Air Quality Index attribute that should provide a more meaningful impact of the smoke on populations. - Additional Blogs and Tutorials
We’ll be digging in a little deeper to the layers referenced above to show how you can use them for more meaningful impact analysis on populations and habitats.
Have questions or comments about this blog? Post them in our GeoNet.

Commenting is not enabled for this article.