The Living Atlas Policy Maps team maintains a set of free layers that contain a wealth of data from the U.S. Census Bureau’s American Community Survey (ACS). Sometime in March 2022, Census will release the newest ACS data for their five-year estimates (2016-2020). Within days of that release, the Living Atlas Policy Maps team updates the ACS layers already available in Living Atlas to provide this new update from Census. Maps and apps that already use these layers will automatically display the most recent Census ACS data, using updated field aliases and updated long descriptions.
The Census ACS layers in Living Atlas cover a wide range of topics on housing, income, internet access, education, disability, health insurance, and more. These layers contain data for states, counties and census tracts. More than 100 layers are available, each focusing on a specific topic. Each topic’s layer is hosted as both boundaries and centroids for your use in analysis, mapping, charting, dashboards, Story Maps, ArcGIS Pro and other applications. These layers are free to use, and can be exported to your local drive if needed.
The data is made available in ArcGIS Online as hosted feature layers, so all you need is an internet connection to use them. Through ArcGIS Living Atlas of the World, you can easily add these layers into your maps and analysis in ArcGIS Online and ArcGIS Pro. You can also use them within applications, dashboards, Story Maps, Insights, Business Analyst and many other ArcGIS tools.
Popup Enhancements
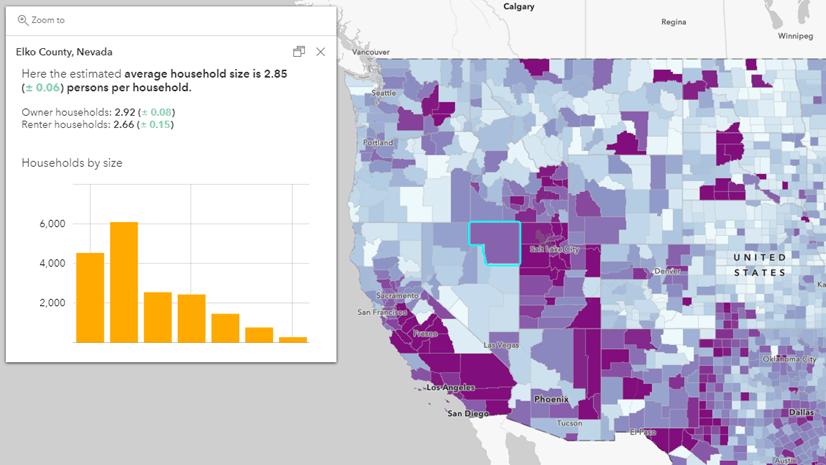
- Earlier this year, we created a Learn Path full of resources that walk through different ways to incorporate margins of error (MOEs) into maps. We presented this work at the ACS Data Users Conference to show these exciting new ways to help everyone see and understand MOEs.
- Census has communicated that 2020 data collection processes were greatly impacted by COVID-19, therefore MOEs might be larger this time around for some attributes. All layers were recently updated to now show MOEs in the popups. By putting the MOEs subtly in the pop-ups, anyone can see the MOEs when needed, while those who are only interested in the estimates still see the layers’ symbology and pop-up as they’ve come to expect.
.\"")
Boundary Enhancements
- The boundaries layers always reflect the TIGER boundaries that are appropriate for the newest ACS figures. In this update, the 2020 TIGER boundaries will be used in the layers.
- 2020 Areal Hydrography sourced from Census was used to shoreline polygons near the ocean, Great Lakes and selected other water bodies.
- Compared to previous years, additional state, county and tract boundaries are shorelined where needed, with additional large or important water bodies cut out of the polygons. This supports map styles like dot density and map effects like drop shadow to work better.

Legend Updates
- Updated legends – many of the layers center their map symbols and colors around the national figure of the attribute being mapped, to emphasize areas with higher or lower figures than that national figure. For example, the U.S. median household income is shown as $62,800 currently in that layer’s legend.
- Once the update occurs in March 2022, a new figure will appear there based on the latest data. The legends clearly state the updated national figures, helping create a reference point for the map reader. You can change it to use another significant value, such as the average for your state.
Using These Layers
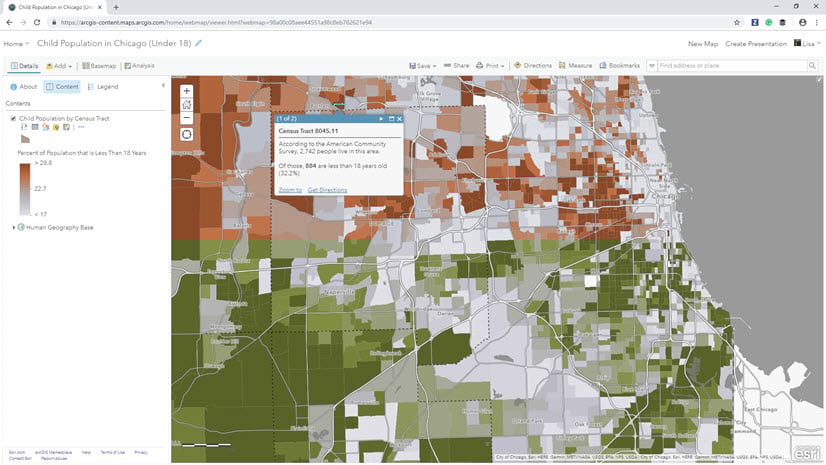
The American Community Survey (ACS) helps local officials, community leaders, and businesses understand the changes taking place in their communities. It is the premier government source for detailed population and housing information about our nation. The ACS layers in Living Atlas provide many of the popular variables directly within the ArcGIS platform. Being able to access these brand-new data values directly within Living Atlas makes it easy to start understanding the changes taking place in your community or areas of interest through maps and further analysis.
Find the layers in ArcGIS Online:
Learn where to find these layers and start using them within your mapping and analysis workflows. Check out this story map to learn how.
Get started:
Learn how to make a map about your community in four easy steps in this blog. You’ll have your own web map of your area in minutes!
Update your existing ACS maps:
When the new ACS figures are released by the Census and updated in Living Atlas, it’s time to for you to check your web maps that use one of these ACS layers to see where you need to make updates to your map’s symbology and popups. If you are using an ACS layer from Living Atlas and have not modified it at all, then you will appreciate knowing that your layer has already been updated, with new data, updated symbology, updated popups.
If you are using as ACS layer from Living Atlas and have modified its symbology, popups, etc., you’ll appreciate that the data has been updated, but your symbology and popups have not. The attribute data in the latest five-year ACS layers changes each December (usually, March 2022 this time around) and is automatically reflected in existing maps. After this release, verify that your map’s symbology breakpoints and popups still make sense with the updated data.
Business Analyst and GeoEnrichment
Developers can access the latest available ACS Data through Esri’s GeoEnrichment Service, while Business Analyst users can access through the Business Analyst web app. Esri will release new ACS 2016-2020 data through GeoEnrichment Service and Business Analyst in June 2022. To learn how to use the current ArcGIS Living Atlas data in Business Analyst, please see the step-by-step guided blog or check out this guided tutorial video.
Questions?
If you have questions about the layers, visit our FAQ, or post on Esri Community’s Living Atlas space. You can also learn more about the layers in this blog.


Article Discussion: