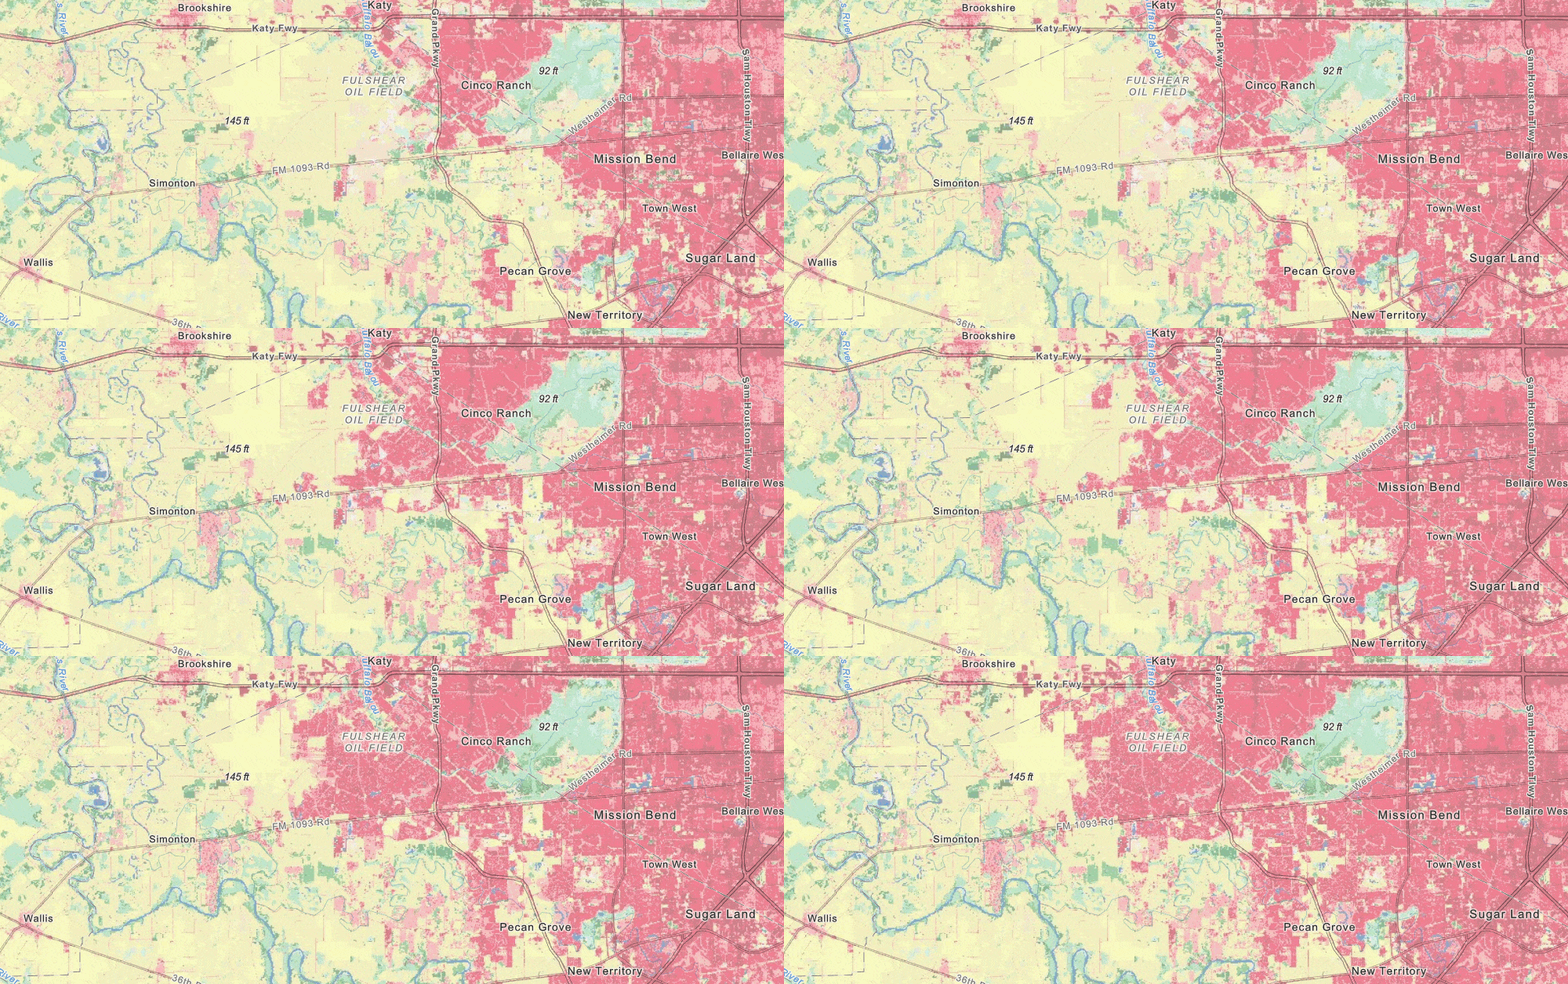
Since we last updated our layer USA NLCD Land Cover time series layer, major changes were made to the underlying land cover datasets.
What you’ll notice right away: MRLC created a land cover image for the year 2019 covering the conterminous United States, and the time series was updated to include it.
Less obvious: All the other land cover images have been revised for the conterminous United States to allow direct comparison between images going back to the beginning of the century.

As before, the layer plays as an animated time series in ArcGIS Pro and ArcGIS Online. The layer behaves the same as before, so you may not need to update your web maps that use the time series layer.
Unfortunately, the same eight year series is not available for Alaska, Hawaii, or Puerto Rico. Unlike last year, there are no changes this year for these places.
Places that did not change in this release
Puerto Rico’s land cover has not been updated by MRLC since 2001.
There is still no NLCD for Hawaii. Hawaii’s land cover has been reclassed and resampled by Esri from the NOAA Office of Coastal Management C-CAP dataset to approximate the classes in this series. The Living Atlas also serves this C-CAP land cover for Hawaii which has a finer resolution than the NLCD.
Follow along with me in this video and I will show you how to get the most from this layer.
We begin at 2:00 when I show you how to open the layer in map viewer classic. Later, at 4:28 I show you how to add the layer to the new map viewer. At 7:33 we can see how to use processing templates in the new map viewer to display land cover using different symbology and/or classifications. We also use the new map viewer to apply blend modes and effects, similar to photoshop. That begins at 9:19.
I then show you how to open the layer in ArcGIS Pro at 11:37. At 14:10 we use a definition query to choose one year in the time series for analysis. Then at 14:41 I show you how to use extract by mask to quantify the area of each land cover class in Loudoun County, Virginia for the year 2019.

Article Discussion: