Recently Bernie posted a blog showing how you can use web scenes in different Story Map templates. I am going to show you how I created a Story Map using a web scene showing the progression of the Mud Creek landslide over 2017 with point cloud scene layers. In this blog I am going to go over how I created point cloud scene layers, elevation layers, a web scene with slides and the final story map.
B
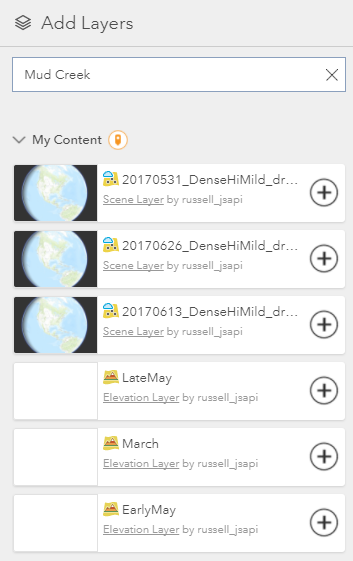
Creating the Elevation Layers
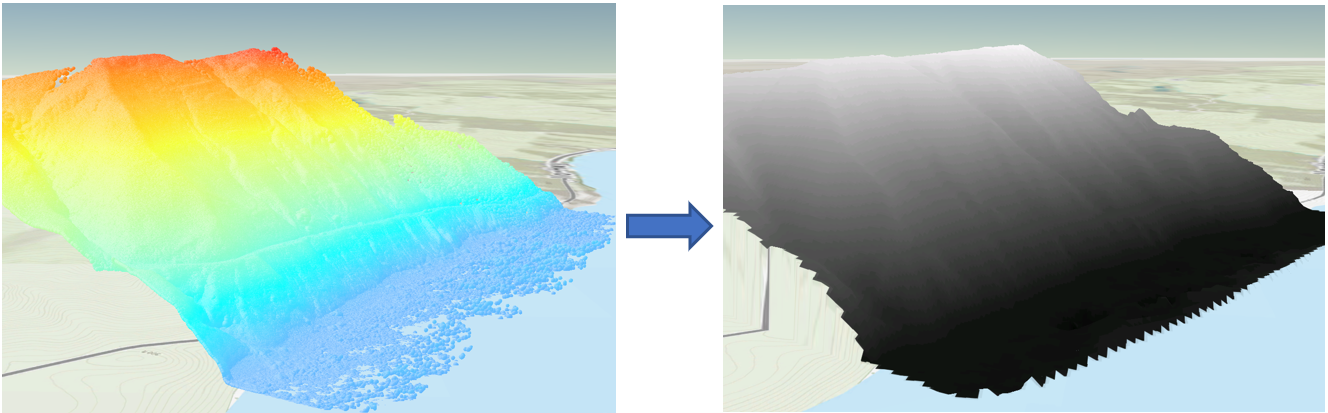
This landslide caused a major change in the landscape over 2017. This change can be seen if when I try to use the LAS datasets in Pro or the final point cloud scene layers I created in this blog and use it with the default elevation layer. You will see the point cloud layers intersecting with the terrain World Terrain. We don’t want to offset the point cloud layers because it wouldn’t be accurate, and each point cloud layer would have a different offset which would also look very weird. Also, I can create my own hosted elevation layers and use tem along with Esri’s default elevation layer within this scene. By being able to use these elevation layers together you will see if you navigate outside the Mud Creek area there is no dropout in the terrain.
To create the raster that will be used to publish the hosted elevation layer I used the LAS dataset to Raster. This will take the LAS datasets for the different stages of the Mud Creek landslide and covert them to a Raster dataset.
After I created a raster for each of recorded LAS datasets I used the Manage Tile Cache tool with the provided elevation tiling scheme in ArcGIS Pro to create a tile cache from the raster datasets. Then I used the Export Tile Cache tool to create a tpks(tile package) from each of the tile caches. I uploaded all the tpks to ArcGIS Online to create the elevation layers to be used in this scene. You can check out more detailed steps in this other blog I wrote up showing how to create 3D layers in ArcGIS Online. Check that blog out here.
B
Creating Point Cloud Scene Layers
To create Point Cloud Scene Layers only requires the use of one tool with my LAS dataset. All I will need to use is the Create Scene Layer Package tool. I use this tool to create a slpk(scene layer package) for each of the LAS datasets. Once the tool has created the slpks, I upload it to ArcGIS Online to create a hosted scene layer. You can do this through Add Item in the browser under My Content or with ArcGIS Pro Share Package tool. The point cloud scene layers will be using the recorded RGB values so we see the true color that was recorded in the LAS dataset. To learn more about point cloud smart mapping check out this blog written by Matt Miller here.
B
Creating the Web Scene in the Scene Viewer
Now that I have all my layers published to ArcGIS Online I can begin to create my web scene. When I uploaded the slpks and tpks to My Content I used the tag “Mud Creek” so the published layers will also have those tags and when I go to add layers in Scene Viewer all I need to do is search my tag and I will see the hosted layers under My Content.
B
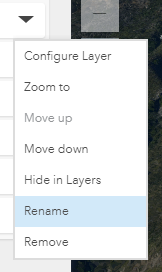
I kept my names for the scene layers pretty geeky and only I really know what the titles mean here. I can update the name of my layers in Scene Viewer by clicking Rename on the menu that opens by clicking on triangle on the layer. I can do this for my scene layers and elevation layers. If I see any of the layers out of order I can also use this menu or drag and drop to reorder them.
B
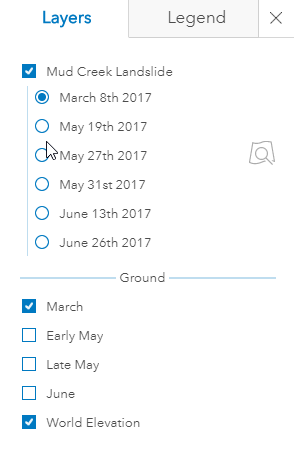
I want to put all my point cloud layers into a Radio Group. What this will do is have the layers setup so that only one point cloud layer can be on at a time because I do not want the users of this web scene to get into a scenario where the layers could overlap because they occupy the same space. To create a group layer click on the Create Layer Group on the Layers pane and click on the black triangle and change the group type from Checkbox to Radio. To learn more about the group types available in Scene Viewer check out the doc here. When we look at the Layer/Legend tool this is what it looks like:
B
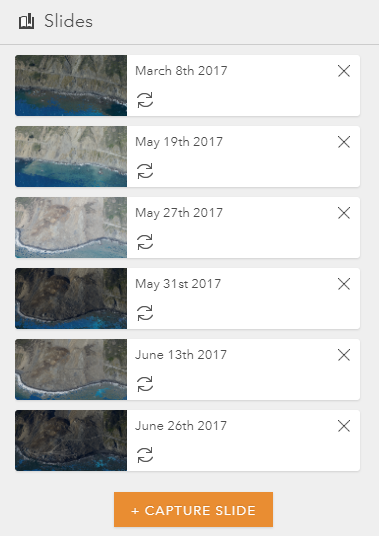
The last thing I want to add to my scene are slides. I am going to use these slides to direct the user to see various stages of the landslide with the correct point cloud scene layer and corresponding elevation layer. To add a slide click on the Slides button in the Layers pane and when you have the layers enabled and the camera view you wish to have as the slides initial view click the capture button. I gave the slides a helpful title so the users can see what point in the timeline this slide is should represent. Now the users of this web scene do not need to use the Layers tool to view the various stages and they can use the slides to navigate the scene.
B
Building the Story Map
I am using the Story Map Cascade template. To build a Cascade Story go to this link and you can begin to build your own Story Map or follow a tutorial. With this template I can build an immersive scrolling scene using images and scenes.
To add a web scene to a Story Map Cascade Immersive section, follow these steps:
Step 1. Add an Immersive section.
Step 2. Click Add media
Step 3. Choose ArcGIS, and optionally choose to search My Content or elsewhere for the scene, and enter a search string.
Step 4. Click the globe icon to filter for scenes. Or search for the Scene you want to use in the Story Map. Here I am searching for Mud Creek (the title & tags used in my web scene)
Step 5. Click on the scene to be added. The scene is automatically added with a minimized UI.
As I add the web scene to the Story Map I can use the edit icon to pick which of the slides I configured in Scene Viewer to use throughout the Story Map.

B
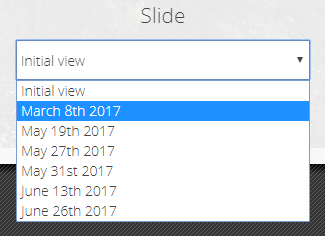
You can pick the slide you want to use with the displayed scene by clicking on Appearance and changing the view from Initial to one of the slides. The user will just need to scroll through the Story Map instead of navigating through the slides in a scene (*Tip – see those helpful titles I gave these slides in Scene Viewer really make it easy to pick which slide should be shown when in this Story Map).
B
Once again I want to give a shout out to Bernie’s blog that covers the quick steps you can follow to easily add in your web scenes to a Cascade Story Map here .
The final Story Map which you can check out here, used information and images from this LATimes article and the USGS website. You can check out these additional resources cited at the bottom of the Story Map.

Cheers,
Russ
B


Article Discussion: