Scene Viewer has big improvements this release to produce stunning scenes and reveal otherwise invisible infrastructure and insight. A new interface in the Building Explorer to pick and isolate floors, producing enjoyable ways to experience large and complex models streamed over the web. Water animation visualization styles transform polygons to water representations with sunlight reflections. Smart mapping for lines and polygons expand choices for depicting attributes and enabling you to discover their data with new, practical workflows.
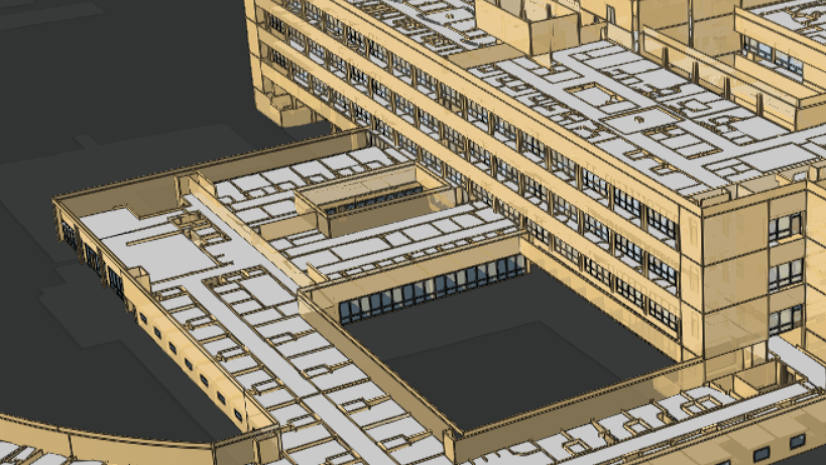
Floor picker in Building Explorer
Browse individual floors with an interface that provides an immediate way to isolate building levels to display spaces, structural assets and infrastructure. It’s never been easier to visualize spaces and find answers with BIM data in Scene Viewer.
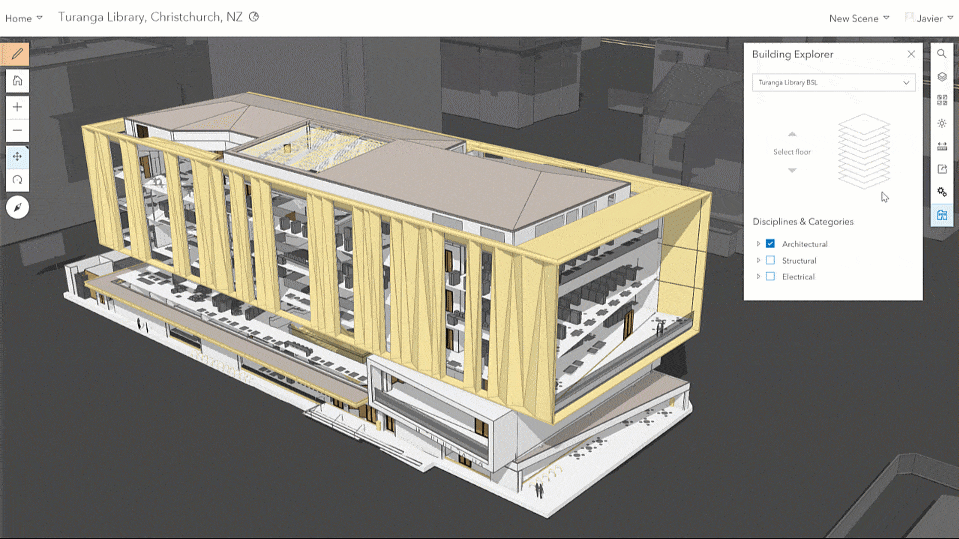
Selecting a Building Scene Layer with the Building Explorer in Scene Viewer displays an interface where you can browse through available floors and pick one to view in isolation. Architectural elements, electrical features, walls or other disciplines and categories can be added to provide an intuitive way to locate otherwise invisible infrastructure.
Animated water visualizations
With the new release, an innovative polygon visualization style helps create beautiful seascapes and waterfronts, or more realistically depict flood impact assessments.

Water styles applied to polygon feature layers will add animated waves to your features representing the surface of oceans, lakes, rivers or pools. Daylight animation controls in Scene Viewer change light source throughout the day, and the water surface reflects the sun as it crosses the sky. Experiment with this style to create stunning visualizations that can be leveraged in apps and Story Maps.
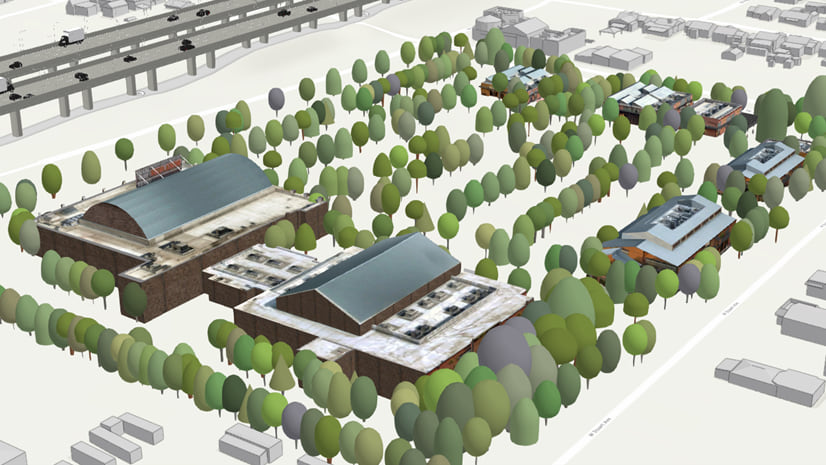
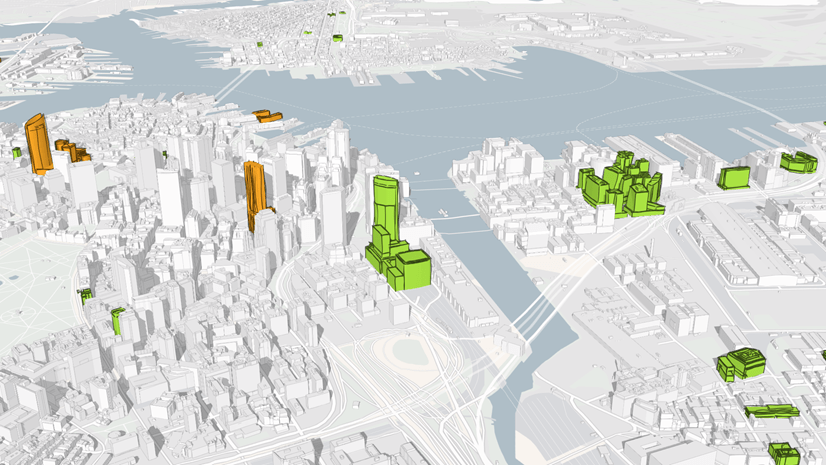
Smart mapping polygon style
Polygon feature layers have new smart mapping styles to help you visualize buildings and other data. It’s now a simple process to extrude polygons by a height attribute to build a simple representation of buildings, and it’s possible to color buildings by additional attributes such a land use, occupancy or other information.
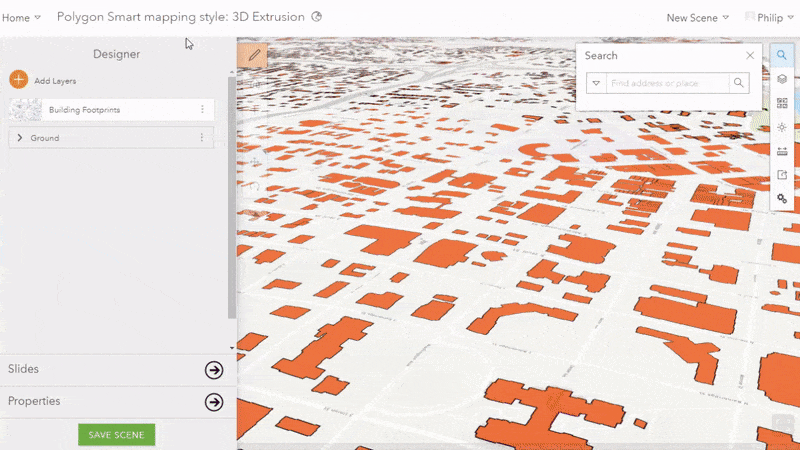
Choose other attributes in 3D Smart mapping polygon styling to select other symbology options while still retaining the capability of extruding polygons later in the workflow. Just like with point and line styles, when a numeric attribute is selected, “3D Counts and Amounts” enables you to choose and symbolize ranges by color scales. “3D Types” enables you to color text or numeric values individually. Both options have properties where a height field can be selected and used to extrude those polygons.
Note: Extruded polygons are a good first step for modeling cities in 3D, but there are other strategies for developing and serving performant scenes showing buildings with higher levels of detail. You can use ArcGIS Pro to create buildings with correct roof shapes as 3D Scene Layers, and you can look into the Local Government Basemap Solution to automate this process with Lidar data. For buildings with an even higher level of detail, publish Revit data to a Building Scene layer.
Smart mapping line styles
You can now symbolize lines as tubes, walls, strips and squares in Scene Viewer. Attribute data can be reflected as color choices, and diameters can be represented with realistic units.
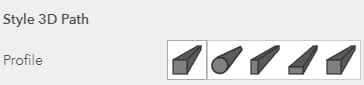
Line styles can be used to represent line features in any one of these four shapes, and a diameter field can be used to size the line accordingly. “3D Counts and Amounts” Line styles can be used to symbolize numeric attributes as a color ramp, and “3D Types” will give color and size options based on attribute values.
This is a great way to develop 3D scenes with data typically maintained with 2D GIS. There’s a lot of potential for how users will take advantage of this feature with their own data, but let’s explore a common scenario:
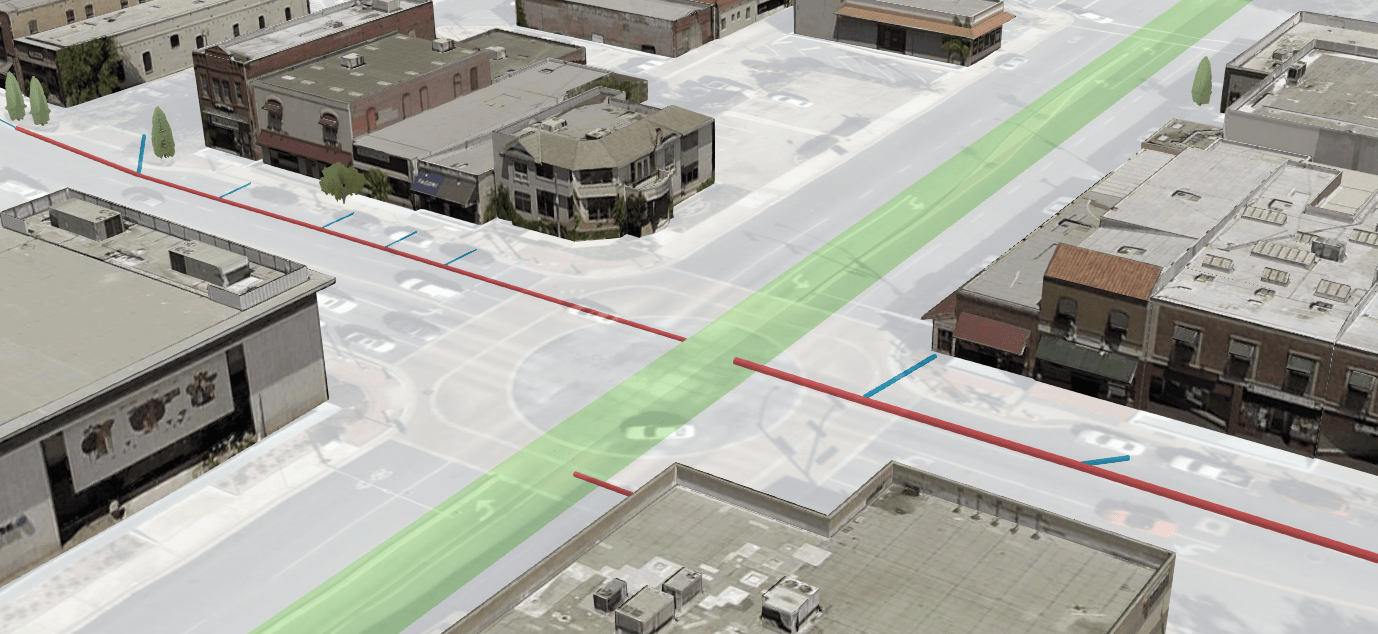
A GIS Analyst for a city is balancing maintaining a storm drain network in 2D while exploring the value of representing that data in 3D. Utilities and drainage data frequently contain attribute information about depth, diameter, material and usage type. All of these are valuable attributes to explore, and smart mapping for lines in Scene Viewer makes it easy to discover 3D visualizations that will change as the features update. Selecting “Diameter” in the layer style reveals the ability to display data as 3D Paths. Many storm drain networks consist of arterial tubes that run to larger, concrete box collectors. It’s easy to differentiate and filter the network by type and use a combination of tubes and rectangular shapes to build a realistic representation of a storm network.
Scene Layer performance enhancements
Esri continues to improve the performance of scene layers. Integrated Mesh and 3D Object scene layers published with the new version 1.7 indexed 3D scene layer (I3S) specification load and display on average twice as fast. For more details, check out this blog and find the standalone tool to upgrade existing Integrated Mesh and 3D Object Scene Layer Packages to 1.7.
This release not only added all those great features but also other additions and bug fixes. For example: support for coordinate system CGCS2000 was built into Scene Viewer. New web styles provide additional choices for 3D symbols like fire hydrants, bicycles, and even new symbol categories like recreation and other infrastructure.
We hope you try these exciting new features and produce beautiful and performant scenes!


Commenting is not enabled for this article.