This blog was originally published in 2018. It was updated in 2024.
As ArcGIS Online organizations grow in the number of members, content items, and purposes, we receive frequent requests for tools to help organizations understand members’ specific activity in the organization. One such tool is the activity report, which allows administrators to download a CSV file with a history of actions made to content, members, organizations, and groups in your ArcGIS Online organization. The activity report can be accessed by administrators on the Organization > Status tab along with the other organization reports – or it can be accessed directly from the Organization > Overview page. Just specify the time span and name of the report and it will be created as a new item within your organization.
Generating the activity report in 3 easy steps:
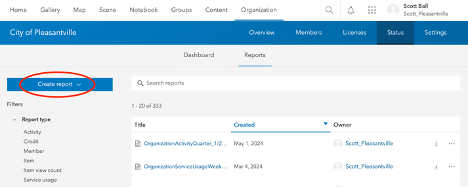
- Navigate to Organization > Status and click ‘Create report’.

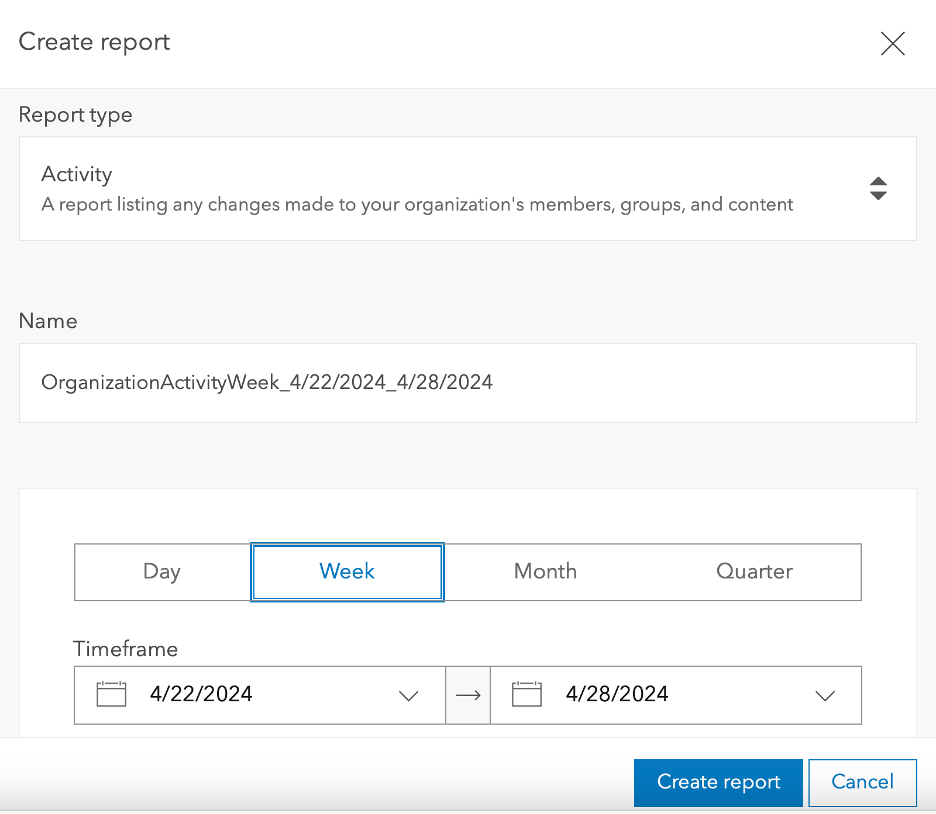
- Create a ‘Single report’ that is an ‘Activity’ report type, choose a timeframe for the report, and give it a name.

- Click on ‘Create report’. When it’s ready, download the report and open the CSV.
Like any good history, the activity report contains columns of information that can be used to explain the who, what, when, where, and why of each event. Although sorting and reading through a CSV file line by line may not be your favorite way to spend a Tuesday afternoon, understanding what the fields and values mean can help identify events and answer questions about your members and content in ArcGIS Online. You can use the activity report as a tool to find specific event entries, or ingest the CSV file with scripting, alerting administrators of specific events.
Below is an example of the downloaded activity report. This blog outlines what data that is tracked in this log and how to find answers to specific questions. A complete description of all fields in the activity report – and in all reports – can be found in the documentation.
Finding out the who, what, when, where with the activity report

What
The Type ID (idType) is an important primary filter to understand What type of event the activity log is describing. There are four common values for idType:
- organization
- item
- user
- group
These identify whether an event occurred with an item, user, group, or organization properties. Fig 1 displays user event types by using an idType filter of ‘user’ on the column. The action field identifies the specific action for each event, further defining the what of the event log. In fig 1, all actions are updates. By reading this example, it is understood that user update actions occurred.
Tip. Use filters to identify events that occur for users, like password reset, account creation, or updates.

Who
Understanding Who is identified in the report entry helps to further understand the event. The id, owner, and actor fields are used to identify ArcGIS Online members and items in the log events. The id field is the target of the event; for idType ‘user’, the target is a username of a member in the organization (fig. 1), for idType ‘item’, the target is an item ID which identifies the item (fig. 2). The owner field identifies the owner of the target and the actor is the identity of the user who performs the action.
The highlighted line in fig. 2 shows that Scott_Pleasantville (actor) added (action) item ID 6f0c21f4856 … (id), which made him both the actor and the owner. Most of the time, members add, delete, and update their own items, but the actor field allows administrators to identify events when other members with appropriate privileges update other users’ items.

What ‘refined’
Author’s note: That’s right, there are two whats in this article.
Although action specifies the type of action performed in the event—for example, create update and share— the request and data field can also be helpful to understand more about the action. The request and data fields further refine the specific action, by displaying the request sent by ArcGIS Online during the event and the data (when appropriate) that is changed. This information can be particularly helpful when identifying sharing changes to an item (Fig 3).
When
The when of the event can be identified with the created_utc field. This displays the date and time of the event in UTC. If it seems strange that Scott was sharing items after work hours, adjust this time for your local time zone.
Where
IP Address specifies the IP address of the computer that submitted the event. This can help to identify the location of the computer.
Why
Why an event occurred is something that you will have to explore when you have identified what happened and who was involved in the action. Check out the documentation for more information and a full description of fields in the Activity report.

Commenting is not enabled for this article.