SDMX is a widely used statistical data and metadata standard. This blog article introduces a workflow for joining SDMX data to geographic points or boundaries, allowing you to perform GIS analysis, create spatial data visualizations, and unlock the collaboration and sharing capabilities of the ArcGIS system.
SDMX
SDMX stands for Statistical Data and Metadata eXchange. It is an international standard for exchanging statistical data and metadata. SDMX provides a framework and guidelines for organizing and sharing statistical data, making it easier for organizations to exchange and compare data. SDMX in its current iteration does not natively support geographic boundary data. Read more on the initiative on the SDMX site.
Data Pipelines
Data Pipelines is a new (beta released in June 2023) data integration capability that makes it faster and easier to access, prepare, and integrate data in ArcGIS Online. With Data Pipelines, you can connect to and read data from where it is stored, perform data preparation operations, and write the data out to a feature layer that is readily available for use anywhere in the ArcGIS system. You can use the Data Pipelines interface to construct, run, and reproduce your data preparation workflows.
Reasons to integrate SDMX data
Integrating SDMX formatted data with geography using ArcGIS offers several benefits. You can maintain existing data flows that are in production for formatting and publishing data using SDMX. Joining your existing data to geographic boundaries (or static points) unlocks the full capabilities of spatial analysis for your data. You can identify spatial relationships and detect patterns over time to support insight and enable better decision-making. For example, mapping demographic data can reveal spatial clusters of low education attainment and further analysis could identify if there are correlations with the distance children live from a school or with high crime rates in the area. Maps are also a tool for sharing data and visualizations with the public or other stakeholders. Once your SDMX data has been published as a feature service (a spatial data format used throughout ArcGIS) you can use the data throughout the ArcGIS system, including making interactive maps, dashboards, and websites. You can share the data with the public or just with others within your organization for them to perform their own spatial analysis and create visualizations and applications from it.
Access requirements
Use of Data Pipelines requires an ArcGIS Online account (it is not currently available for ArcGIS Enterprise). To publish a feature service, you will need at least a Creator account. There are no additional licensing requirements for running Data Pipelines, but running the tools does consume credits. Read more on how credits are charged.
Use SDMX and Data Pipelines
This section will go step by step through the process for bringing data in from an SDMX query to publishing it as a feature service in ArcGIS. This tutorial uses geographic boundaries from ArcGIS Living Atlas. ArcGIS Living Atlas contains over 2,500 boundary datasets, including national and subnational administrative boundaries, environmental areas, and geometric areas like grids. You can also upload your own geographic data and boundaries to ArcGIS Online from a variety of formats. Find more detail on that process in the Publish hosted feature layers help topic.
To bring the output from an SDMX query into Data Pipelines, the URL must output a CSV. To output an SDMX query in CSV format, you can add a URL parameter, but note that the formatting of the URL query can vary based on your SDMX provider. For more on the SDMX-CSV standard, see the SDMX Technical Working Group’s SDMX-CSV Field Guide. For specific data providers, check their documentation to see how to specify the CSV format. For example, in sending an SDMX-CSV request for Australian Bureau of Statistics (ABS) data, “&format=CSV” is appended to the base URL. See SDMX CSV in the ABS documentation.
Note: Some SDMX API providers require you to specify the output format in the header of the URL request. This is not yet supported in Data Pipelines.
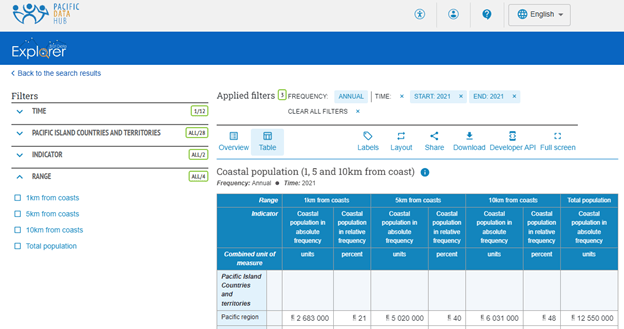
The following example uses a dataset on coastal population from the Pacific Data Hub, an initiative led by the Pacific Community (SPC) and supported by the New Zealand Ministry of Foreign Affairs and Trade.
- In the Pacific Data Hub, construct a query using the drop-down menus on the left, specifying the dimensions, measures, and attributes to include in the response—in this case, just the year 2021 and including all the countries and territories.
2. Select Developer API from the options above the table and copy the SDMX URL.
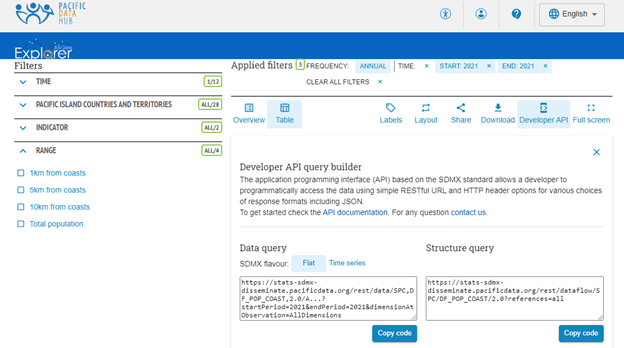
3. Append the CSV URL parameter to the request and copy the new URL, for example:
4. In ArcGIS Online, launch Data Pipelines from the app launcher in the upper right corner and click Create data pipeline.
5. Click Inputs from the menu on the left, click Public URL, and paste in the URL you created above. From the Data format drop-down menu, click CSV or delimited and leave the rest of the defaults.
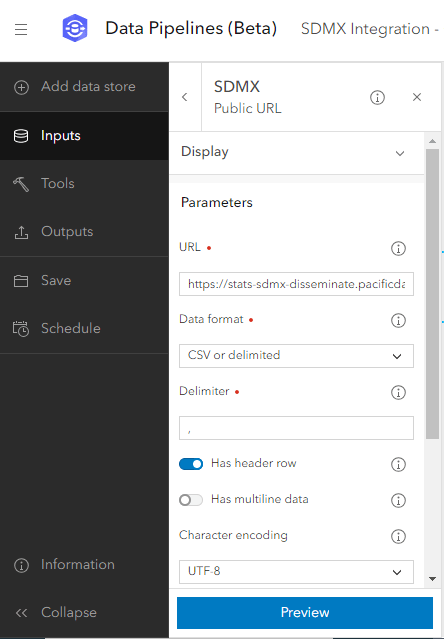
6. Optionally, expand the Display drop-down menu at the top of the Public URL configuration menu and change the display name of this element (for example, to SDMX Input).
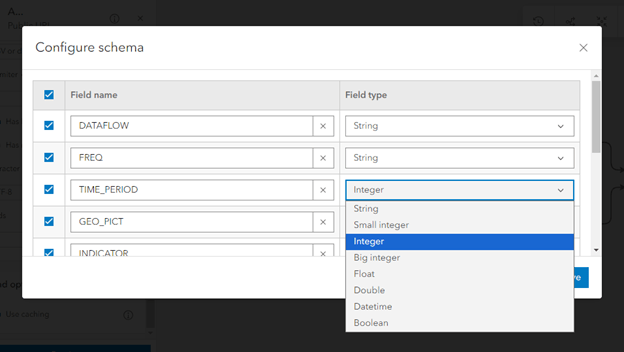
7. Scroll down in the Public URL configuration menu and click Configure schema. Change any of the field types to make them more appropriate for the data—for example, the TIME_PERIOD measure can be changed to the Datetime field type. Optionally, edit any of the field names and uncheck fields that will not be needed for analysis or as metadata.
8. To bring in the geographic boundaries of the islands, click Inputs again, scroll down to the ArcGIS section, and click Feature layer.
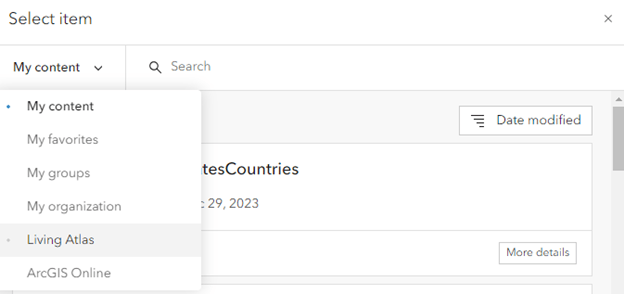
9. Click Select item, and click the My content drop-down menu. Click Living Atlas.
10. Search world country boundaries and click the feature service with the same name. Alternatively, search by item ID, in this case, 74572bf865fc4025978dea11507adc96.
To join the input SDMX dataset to the boundaries, you need a common field. In this case, use the ISO code that exists in both datasets. In the case of subnational boundaries or other geographic datasets, you could join based on any common field, such as a name or other code. You can also perform calculations on the fields using the Calculate field tool to get an exact match—for example, if there is a field combining the ISO code with the country name and you need to isolate just the code.
11. Click Tools on the left and then click the Calculate field tool to explore this capability.
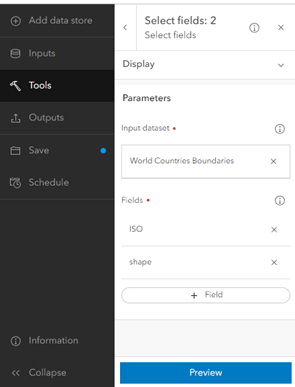
The World Country Boundaries layer from the Living Atlas has more fields than you want to include when you join it to the SDMX input, so you will create an intermediate layer with just the geometry and ISO code.
12. Under Tools, click Select fields, type World Countries Boundaries in the Input dataset text box, and select ISO and shape as the fields.
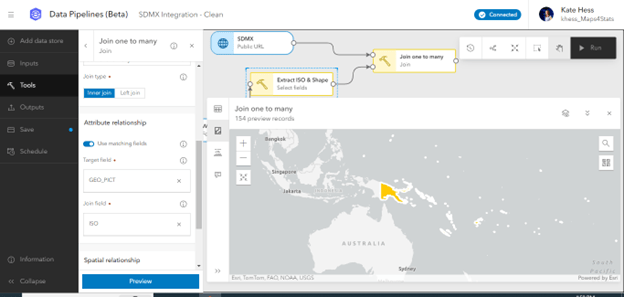
13. Under Tools, click Join.
The Target dataset is the SDMX input and the Join dataset is the Select fields intermediate output.
14. Leave the defaults of Join one to many and Inner join. Under Attribute relationship, click Use matching fields and click ISO and GEO_PICT, which is the name for the ISO code field in the Pacific Data Hub dataset.
15. Preview the output and click the map button to confirm that the data now has a spatial component.
16. To specify the output format for the spatial dataset, click Outputs on the left and click Feature layer.
The Input dataset is the last Join one to many step, and Geometry should default to the shape field. In this case, you can leave Time type as None, but if you had selected multiple time steps of data, you could specify that here and construct visualizations of change over time.
17. For Output method, click Create because this is the first time you are generating this feature layer.
If you were setting this up to run on a recurring schedule when the source data is updated, you could select Replace.
18. Type a name in the Output name text box, save the project from the menu on the left, and click Run at the top right.
Now you have an ArcGIS Online feature service, which you can bring into Map Viewer or open in ArcGIS Pro for visualization, analysis, and sharing. Check out the documentation for help getting started in Map Viewer and get inspiration and tutorials from the Tutorials gallery.
Visualizing data
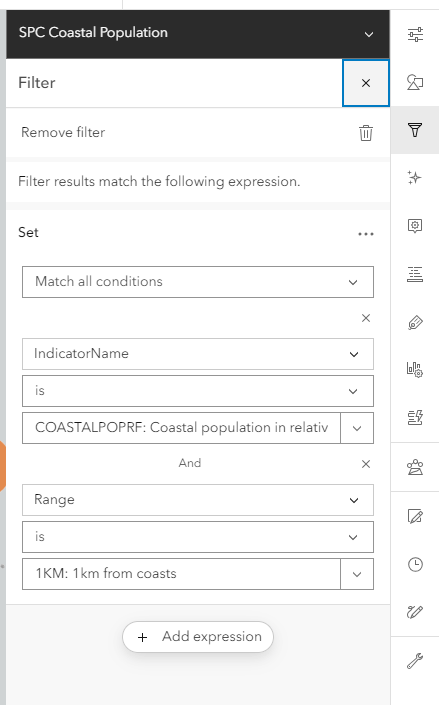
Because of the formatting of SDMX tables, you will have multiple features (rows in the data table) for each geographic area. For example, there will be a polygon for Fiji’s population 1 kilometers from the coast, another polygon for Fiji’s population 5 kilometers from the coast, another with the percent of Fiji’s population 5 kilometers from the coast, and so on. This allows you to make many maps showing different patterns and datasets from one table, but to focus in on comparable data values, you will use the filtering capabilities within Map Viewer.
For the coastal population dataset in the screenshot below, a filter focuses the map results on just the rows containing the indicator for coastal population in relative frequency (so focusing on percentages of the population rather than the absolute number of people), and specifically filtering for the Range value of 1KM: 1km from coasts. Now when the IndicatorValue field is selected for the visualization, each geographic area will have one data point that can be directly compared.
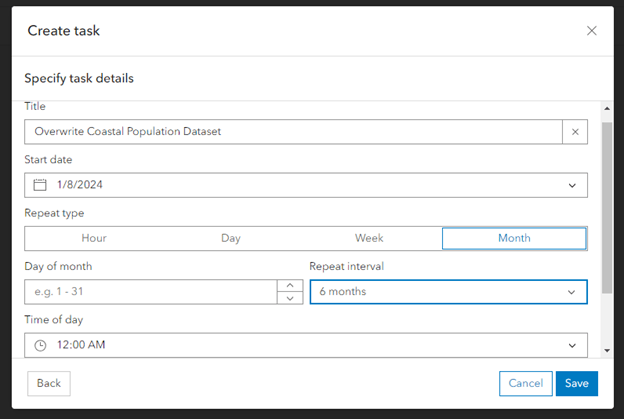
Scheduling capability
Once you build a data pipeline, you can schedule it to run automatically at a predetermined interval. For example, if the SDMX URL was being updated with new data every 6 months, you could schedule the data pipeline to repeat every 6 months and the feature service would be updated with the latest data. This new data would then be reflected in any maps or live applications built with the feature service.
Next steps and feedback
Data Pipelines is still in a beta release, with updates adding new capabilities based on feedback from the SDMX community. One topic we are actively looking into is support for SDMX codelists. To give feedback on the current capabilities, request additional functionality, or share a successful use case, visit the Data Pipelines community.

Article Discussion: