Landsat imagery often faces challenges with cloud cover and shadows obscuring ground details and hindering clear images. In this blog, we will provide a step-by-step workflow using ArcGIS Online raster analysis to create cloud-free imagery from Landsat imagery from the Living Atlas. We will also showcase the enhanced capability of Landsat Level-2 multispectral imagery for conducting large-scale analysis in ArcGIS Online. This imagery is accessible through the ArcGIS Living Atlas of the World.
License requirement
Professional or Professional Plus user type license. For more information about ArcGIS Online capabilities included with each user type, please check out More ArcGIS Users Now Have Access to Imagery Hosting and Analysis in ArcGIS Online.
Preparation
Transferring a large volume of imagery data during imagery processing is usually time-consuming, especially when the source data is stored far from where the analysis is being processed. To expedite this process for a selected list of Living Atlas layers (Landsat Level 2, NAIP and Sentinel-1 RTC), users have the opportunity to move the imagery analysis to the region where the Living Atlas data are located. Once the analysis is complete, the output will be transferred back and shared in the user’s organization.
This approach can significantly improve the performance of analyzing these Living Atlas layers, which allows large volumes of data to be processed efficiently and bypass the request size limit restriction on image services. Permission to use this approach can be enabled by the administrator of your ArcGIS Online organization. By default, the feature is turned off, but can be enabled for your organization. When the feature is enabled, the input data will be temporarily co-located in the same region with the Living Atlas data for optimized processing. The analysis input includes the raster function templates and deep learning models.
This feature is currently in Beta with known limitations. To enable this feature, please have your ArcGIS Online organization administrator follow these steps:
- Access Organization Settings.
- Navigate to Security Settings, look for the Raster analysis with Living Atlas data (Beta) option at the bottom.
- Enable the option Allow your data to leave your region temporarily and be co-located with Living Atlas data during raster analysis for better performance.

Analysis workflow
Preparing the input layer
Before beginning your analysis, it is important to prepare the input layer to ensure all required bands can be accessed. The default processing template for the Landsat Level-2 layer is “Natural Color with DRA”, which selects a band combination of 4,3,2. You will need to prepare the Landsat imagery layer before conducting your analysis to be sure that all the bands are available for the analysis workflow.
Step 1: Add layer and zoom to interest area:
In the Map Viewer, search for “Landsat Level-2” through the Living Atlas and add this layer to the map. Because Landsat layer has the global coverage, this workflow can be used anywhere that have images available within your defined time period. We use Columbia Glacier in Alaska, USA as an example. It has long been an archetype of the world’s most rapidly changing glaciers. In the map, search by location and zoom to your area of interest.
Step 2: Configure processing template:
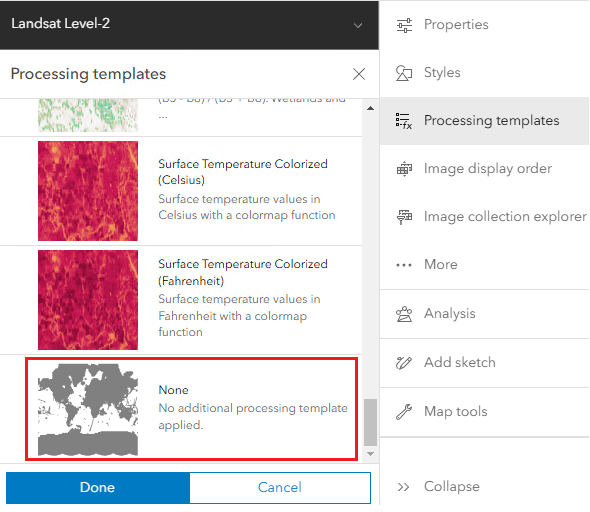
Open the Processing templates pane on the Settings (light) toolbar. Select “None” and click Done button to expose all bands for downstream analysis.
Step 3: Verify all bands are available:
In the Styles pane on the Settings (light) toolbar, choose the RGB style options to ensure all 10 bands are listed in the dropdown menu.

Step 4: (Optional) Save the configured layer:
On the Contents (dark) toolbar, click Layers, access the layer options (3-dots button) to save this configured layer as a new layer item. This will allow you to skip step 2 and 3 in future.
Defining an image filter for the analysis
In this workflow, it is crucial to accurately define filters to process only the images relevant to your area of interest and time period. Since the Landsat imagery contains many more images than needed for your analysis, it is important to limit the number of images used in the analysis and focus the analysis on your particular study area. Focusing the analysis on a selection of images will reduce the processing time and the cost of the analysis.
Step 5: There are three methods provided to apply an image filter, and you can choose one of the following options:
Option 1. (Recommended) Leveraging the raster function template to define filters:
-
- You can define filters in the raster function template, instructions are available in the next section “Running the Analysis”.
Option 2. Using Filter pane:
-
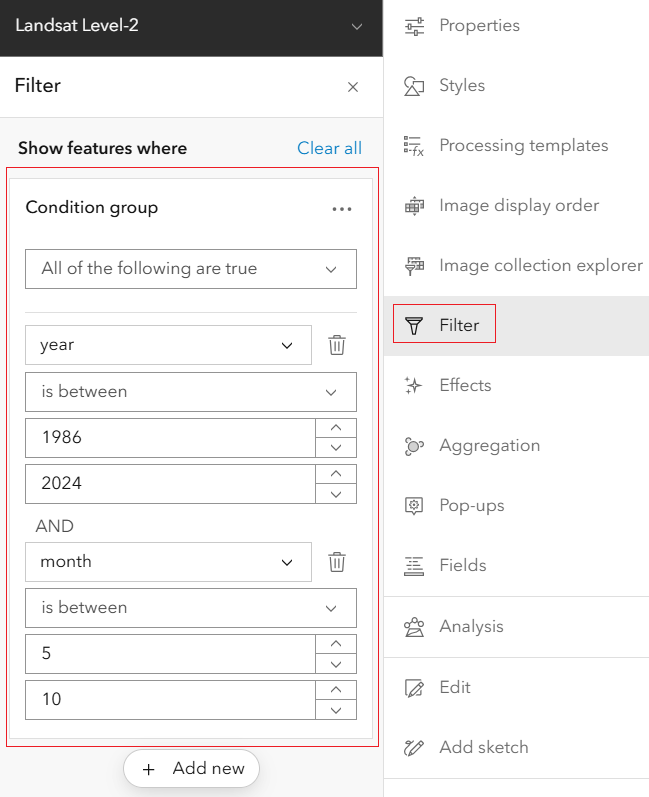
- Open the Filter pane on the Settings (light) toolbar.
- Add condition groups, for example, (year BETWEEN 1986 AND 2024) AND (month BETWEEN 5 AND 10) AND cloudcover < 0.5.
- Click Save to apply the filter.
Option 3. Utilizing Image collection explorer pane:
-
- Access the Image collection explorer pane on the Settings (light) toolbar, this tool allows to preview the images and their metadata.
- Utilize filters dialogue to filter by interested images. Note that you can only define one filter, then manually select images.
- Use the Add to map button to add the selected images as a new layer to the map.

Running the analysis
Now you are ready to create your cloud-free imagery layer in ArcGIS Online by applying a raster function template from the Living Atlas. The output is a multidimensional imagery layer, representing a multidimensional data cube for given time interval, for example, yearly, monthly, daily and so on. If you are unfamiliar with the raster function template, please refer to this documentation.
Note: This template works well to run the analysis and generate a new output layer, but it is not suitable for dynamic processing in Processing templates pane, or preview in the Analysis pane.
Step 6: Open Analysis pane and add the raster function template from Living Atlas:
-
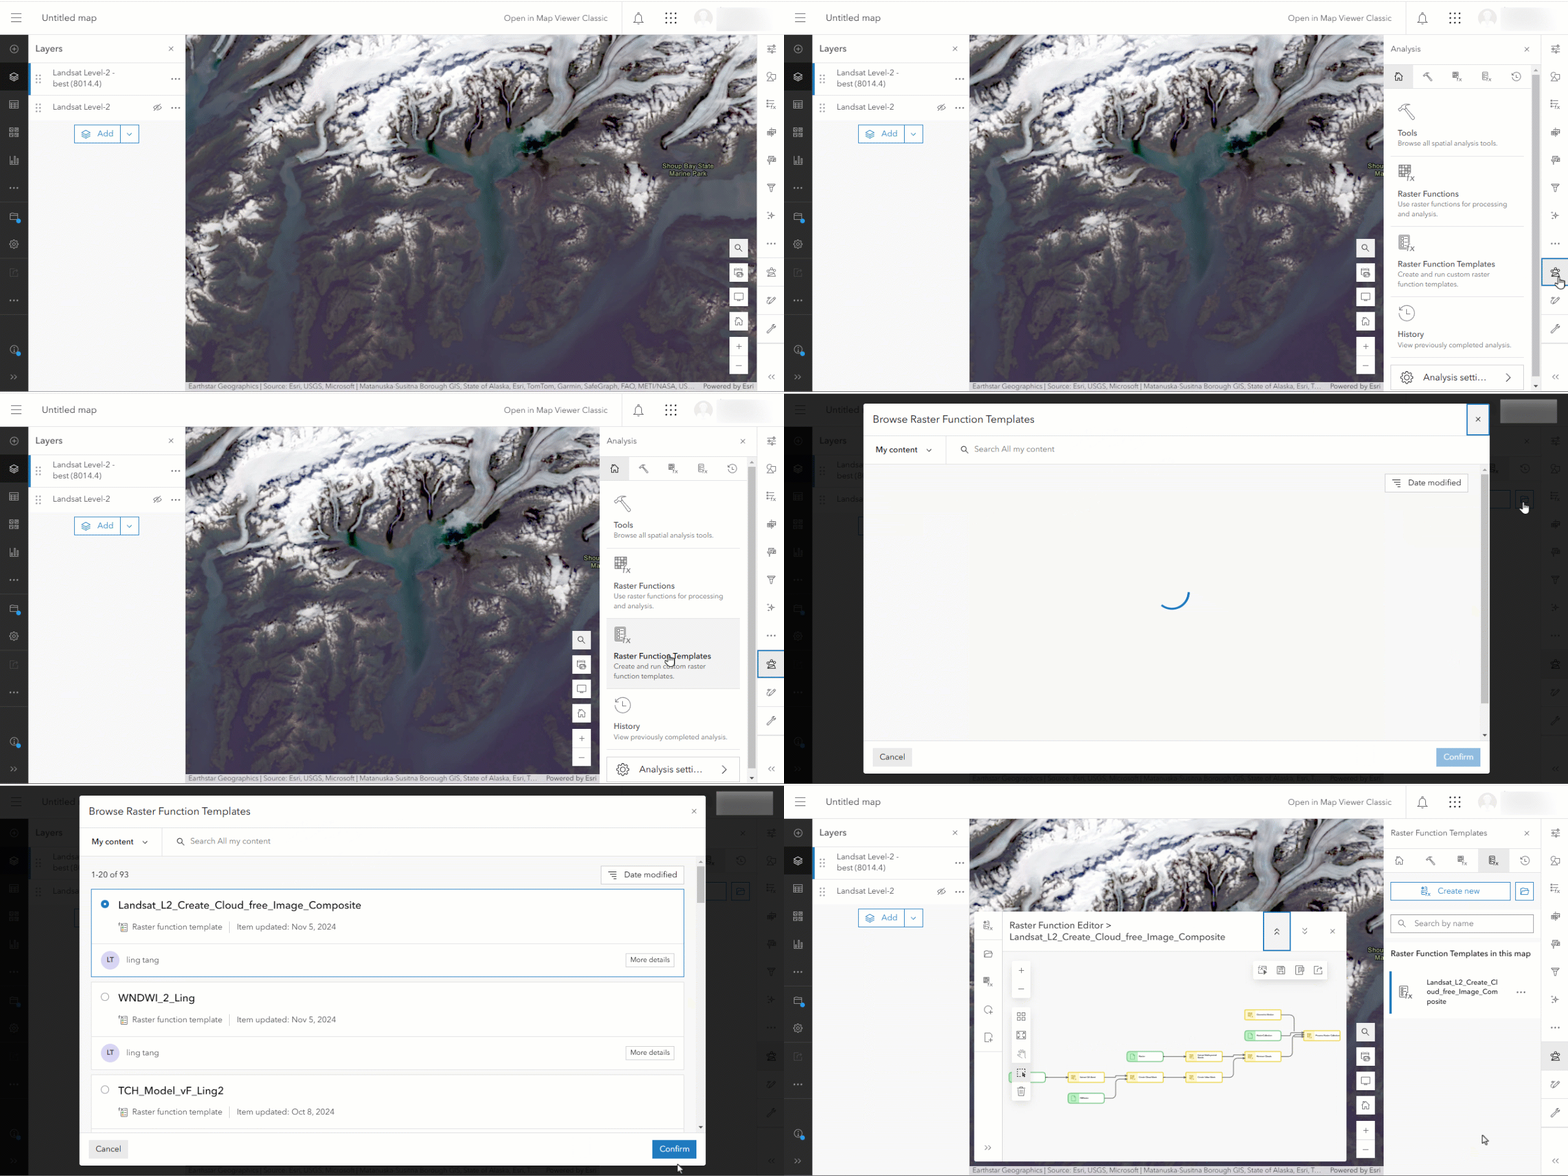
- On the Settings (light) toolbar, open Analysis pane.
- Click the Raster Function Templates entry point to open this tab.
- Use the Browse Raster Function Template button to browse and select the item Create Cloud Free Image Composite with Landsat Level-2 in the Living Atlas, this will open the template in the Raster Function Editor, and simultaneously add it to the Raster Function Templates tab in Analysis pane.
Step 7: Explore this raster function template in the Raster Function Editor:
-
- In the Raster Function Editor, please use some time to explore each raster function in the chain and understand their settings.
Step 8: Open the template in Analysis pane:
-
- In Analysis pane, in Raster Function Templates tab, left-click the item you just added, this opens it to run the workflow.
Step 9: Fill in raster input:
-
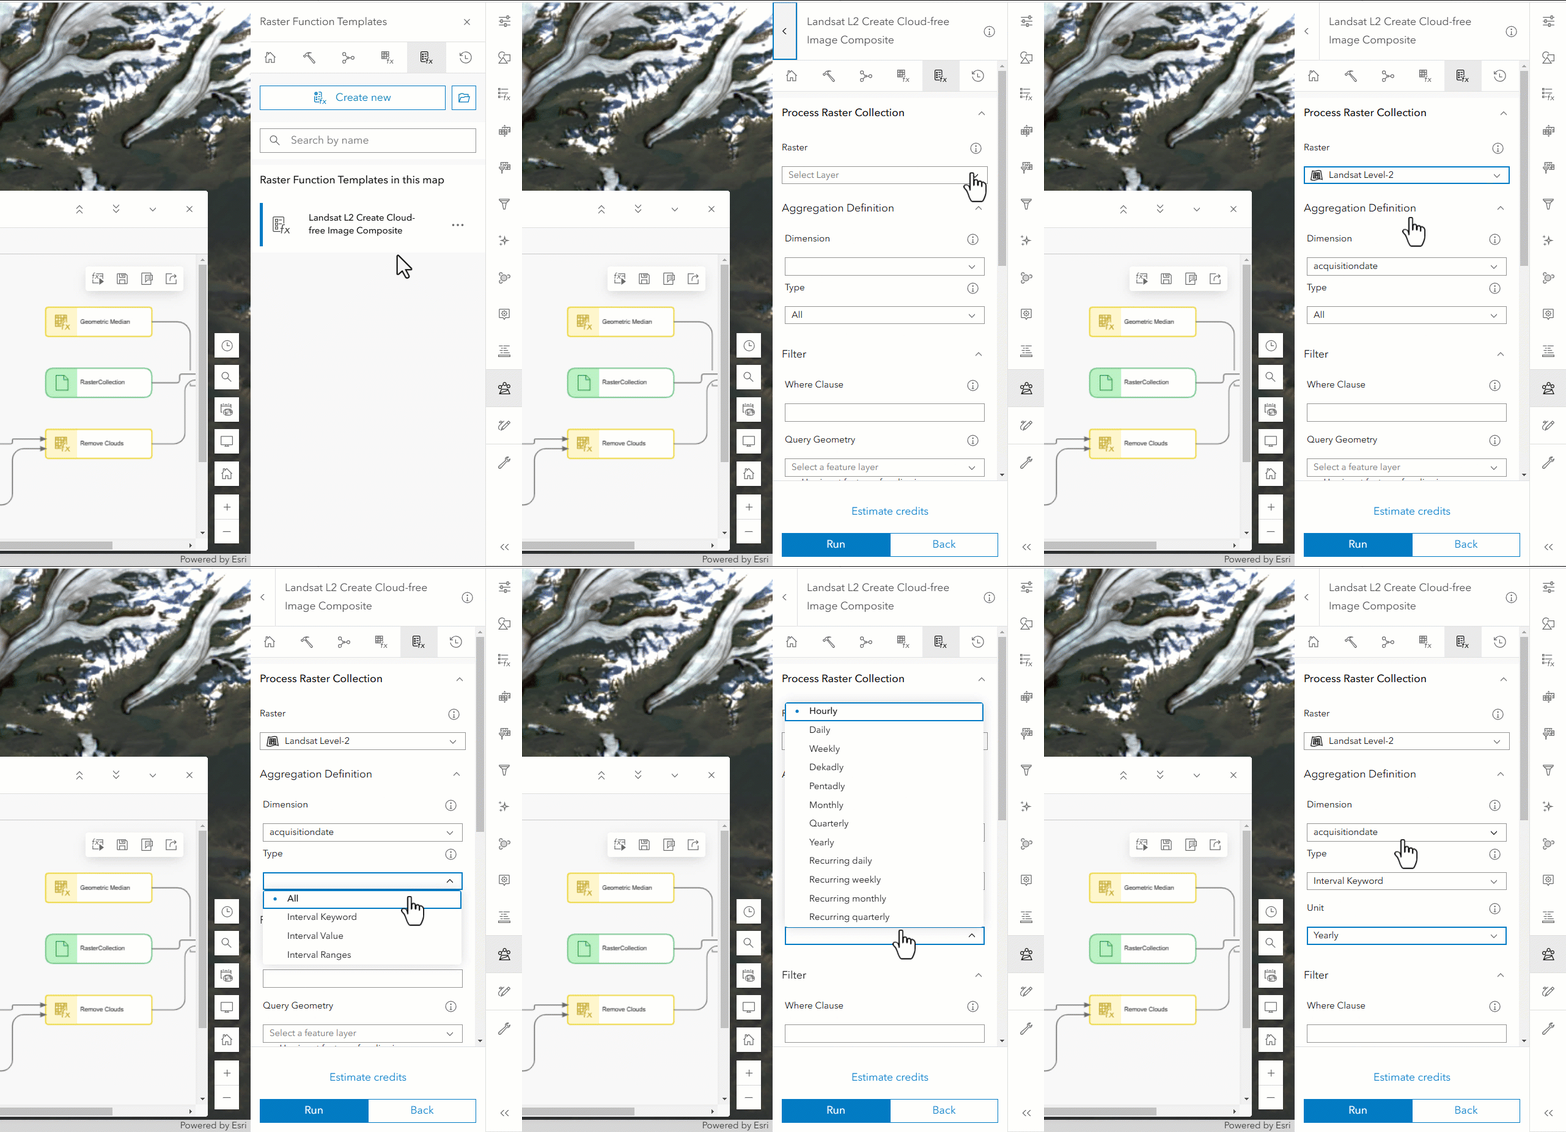
- Under Process Raster Collection block, select the “Landsat Level 2” layer in Raster parameter. This is the only raster input needed for this workflow.
Step 10: Define an aggregation type:
-
- Under Aggregation Definition, Dimension parameter is automatically filled with the acquisition date field. In Type, select option “Interval Keyword”, and Unit “Yearly”. It will aggregate the output to yearly time interval.
Step 11: Define a filter (if not yet done in Step 5):
-
- In the Filter block, define the Where Clause using a SQL expression, for example, (year BETWEEN 1986 AND 2024) AND (month BETWEEN 5 AND 10) AND cloudcover < 0.5.
Step 12: Define spatial extent, ensure to select at least one of the following two options:
-
- Select a feature layer in Query Geometry. Use the checkbox to choose to use feature geometries, or uncheck it to use the bounding box that defines the extent with minimize union of polygons.
- Specify a Processing extent in Environment Settings, for instance, Display Extent, or define a layer.
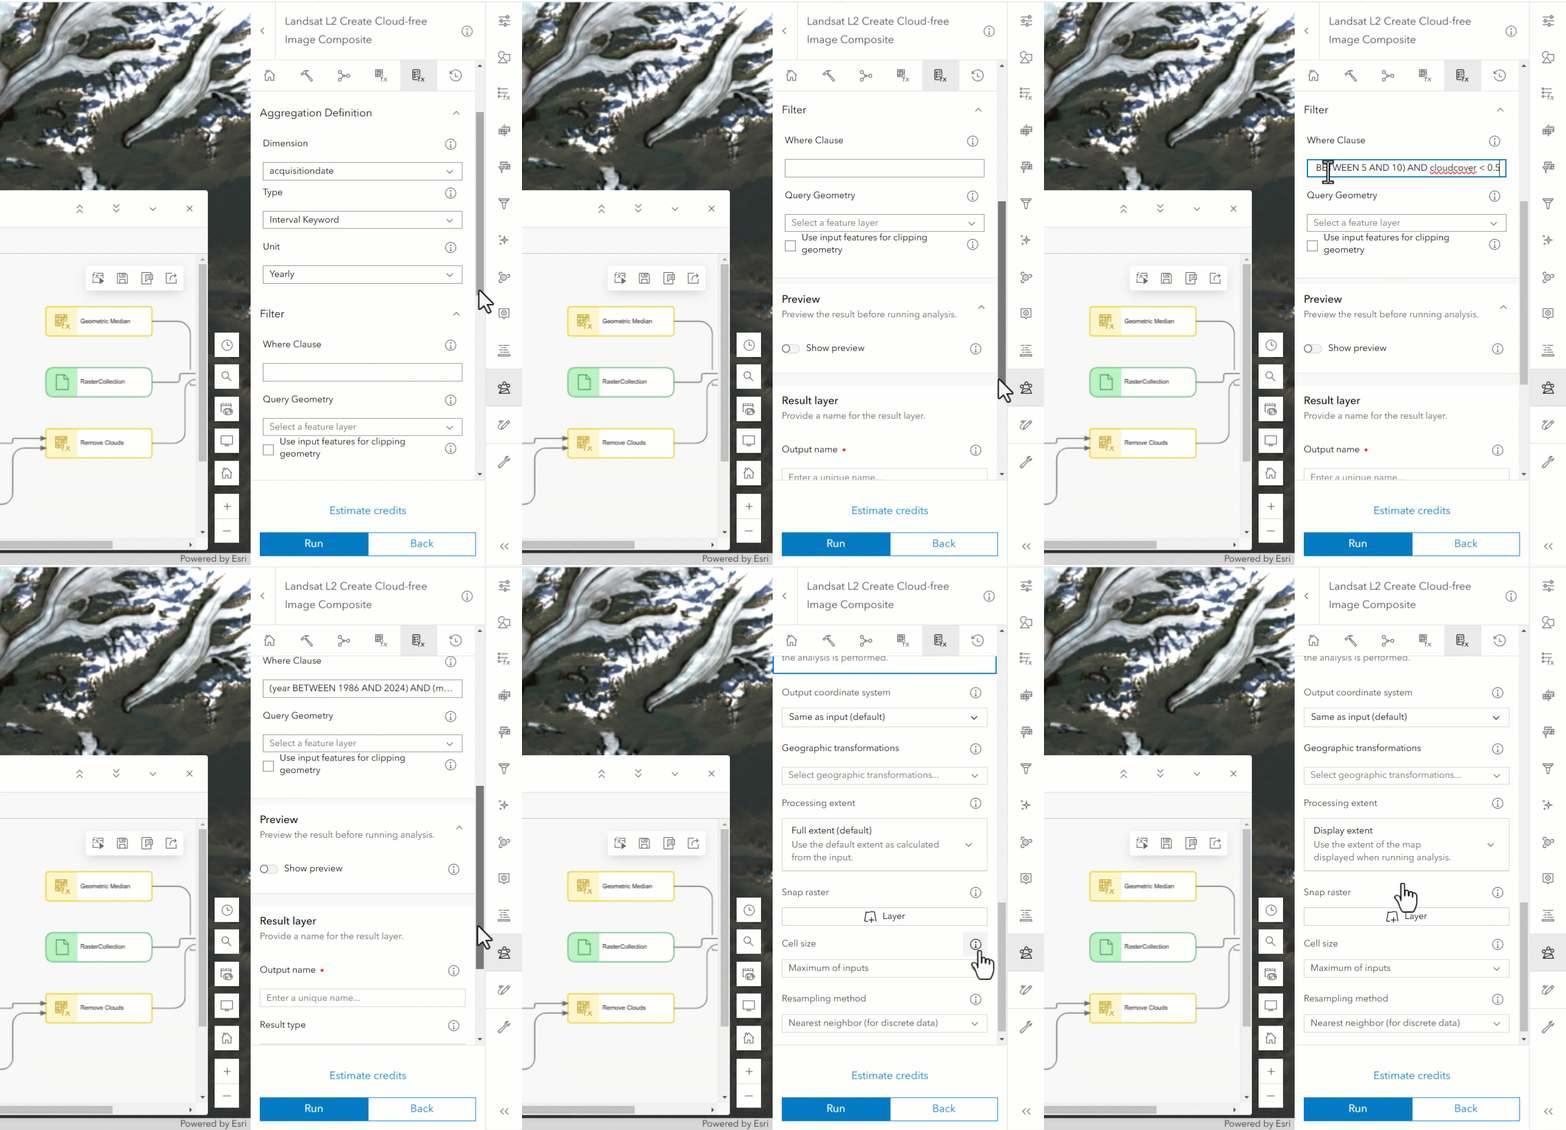
Step 13: Provide unique output name in the Result layer block.
Step 14: Use the Estimate credits button to estimate the credits required for the analysis.
-
- ArcGIS Online jobs need credits, for more details on credit charging, please refer to Understand credits for spatial analysis.
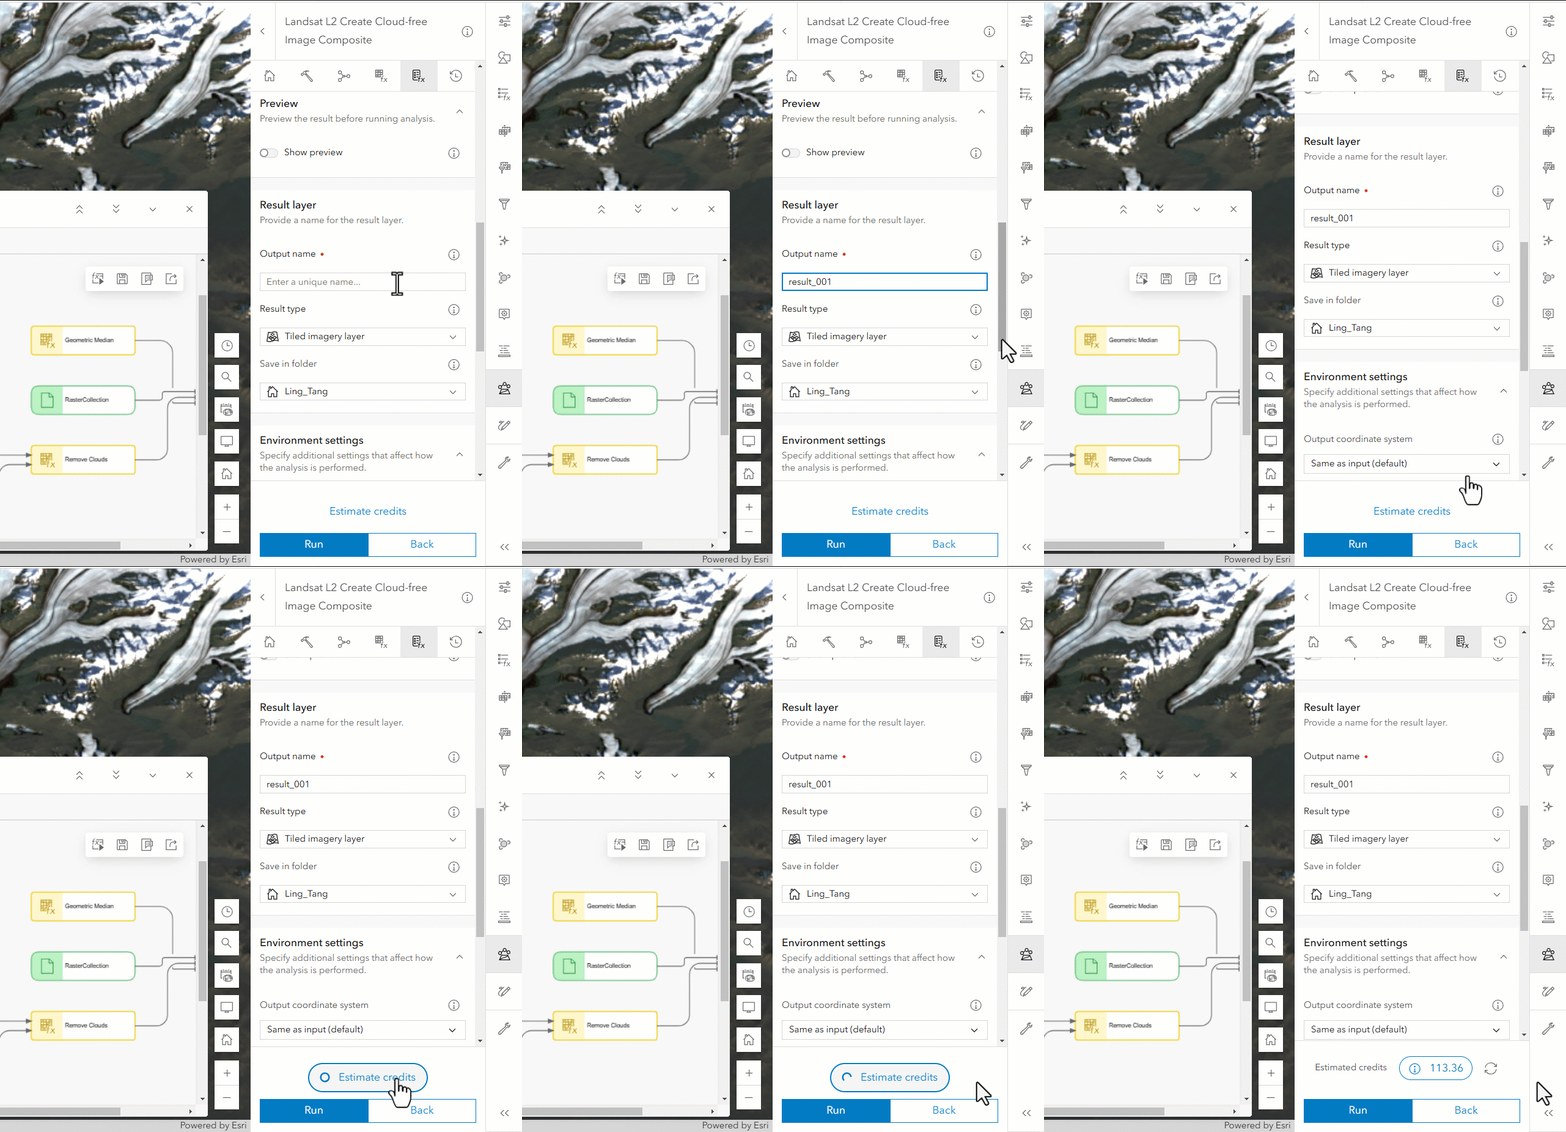
Step 15: Run the analysis:
-
- Click the Run button to submit the job for processing.
- when the estimated credits surpasses the default credit threshold (100 credits), you will see a notification requesting further confirmation. You can modify this credit threshold in the Analysis Settings in the landing page of the Analysis pane. Please refer to the Crediting for more details.
- You can use the History tab to monitor this analysis job.

Visualize the result
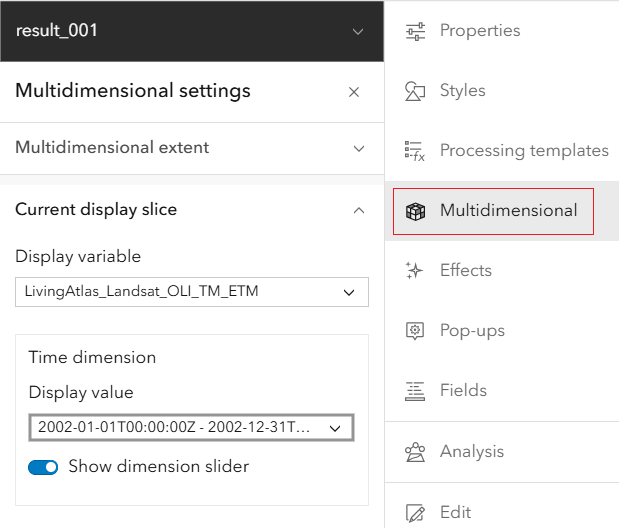
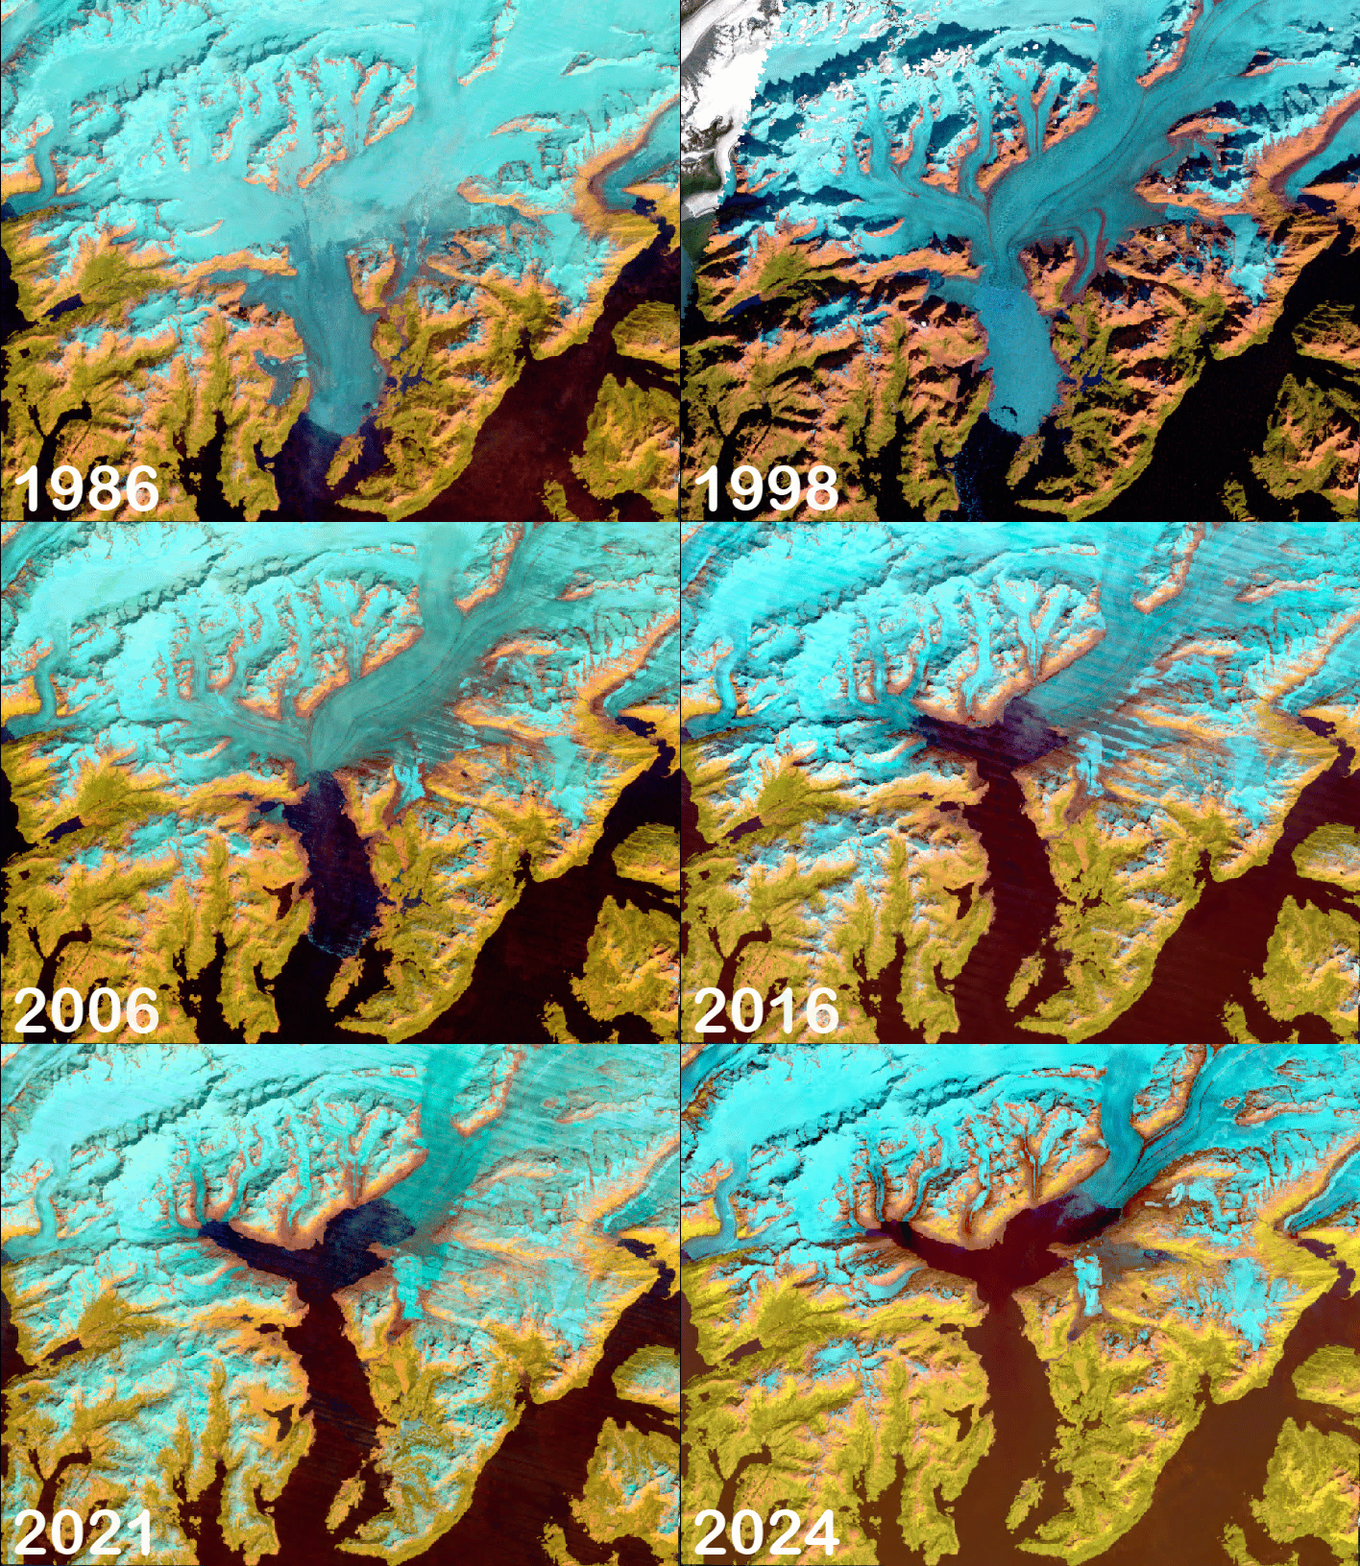
Once the processing is complete, a new multidimensional imagery layer is created with a yearly time interval. Through the Multidimensional pane, we can visualize the new layer by selecting a particular year or animate the imagery layer to see changes as it happens over time.
To highlight the glacier and distinguish the changes over the years, we can define the Red, Green and Blue bands to use Band 6 (Shortwave infrared 1), Band 5 (Near infrared), and Band 4 (Red).
Ready to take the next step?
You can use the cloud-free analysis-ready Landsat imagery for other applications, such as landcover classification and change detection. This Landsat Level-2 product has removed the scale factor and offset and it is shared using the floating pixel values to get truly analysis ready imagery.
The Product Team is interested in your thoughts and ideas. Influence the direction of future releases when you visit us and leave a comment via the Imagery in ArcGIS Online community on Esri Community.

Article Discussion: