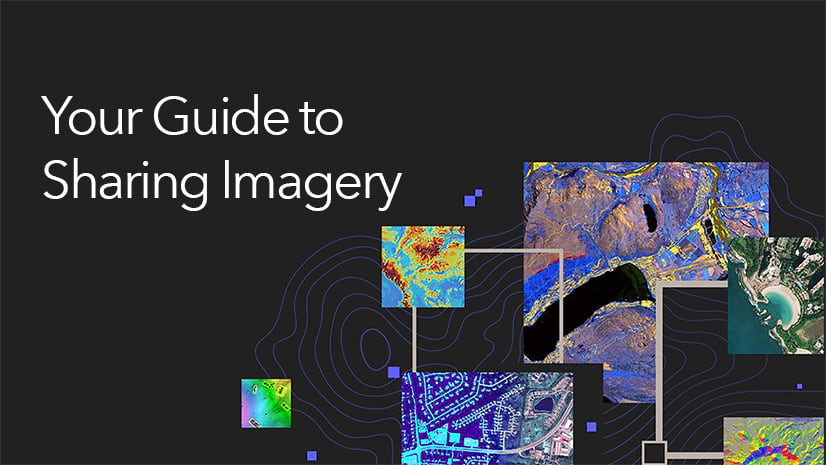
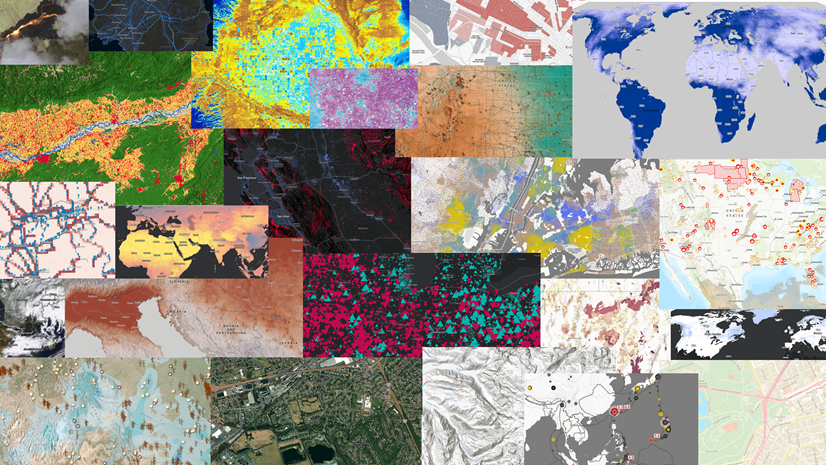
ArcGIS Image for ArcGIS Online is the newest member of the ArcGIS Image suite of products for hosting, analyzing, and streaming imagery and raster data. As a software-as-a-service, ArcGIS Image Online has helped organizations share their imagery collections with countless users and eliminate infrastructure management. In our latest release, we’ve added capabilities that streamline the way you: export imagery for offline workflows, share imagery using ArcGIS Online, and intuitively visualize weather phenomena such as ocean currents and winds.
Take imagery offline
Imagery layers can now be exported into tile packages for offline use on mobile devices. Take any imagery or the result of your image analysis and make them accessible in mobile applications that can be easily taken out into the field to verify, identify, and inspect assets and surroundings.
Support for OGC compliant services
WMTS
When publishing a Tiled imagery layer, the WMTS capability is now automatically enabled if the compression method is set as JPEG and the spatial reference has an EPSG code.
Publish mosaic datasets referencing imagery on cloud storage to ArcGIS Online
Earlier releases of ArcGIS Image Online supported mosaic datasets referencing images on a file share. Now, if you have data on a cloud store, you can create an ACS file to point to your data, create a mosaic dataset, and publish that mosaic dataset as an imagery layer to ArcGIS Online using the create hosted imagery wizard. The images will be copied from the cloud store to ArcGIS Online as part of the publishing process.
Style and Animate Imagery
Enhance symbology of imagery layers using the new Map Viewer & JavaScript API
Multidimensional raster data is often used in the scientific community to display meteorological and oceanographic data such as temperature, humidity, wind speed, and direction. During the Developer Summit, Anne Fitz delivered a jaw-dropping demonstration illustrating the power of visualization combined with animation. During the demo, she used new flow styling tools to visualize data from the North American Land Data Simulation System containing variables such as hourly wind speed and direction data for the past 40 years.
Learn how you can create visualizations like the one presented above. Check out our documentation.
More improvements
In addition to the new capabilities above, several bug fixes and minor improvements have gone into this release.
Ready to take the next step
As an ArcGIS Image Online user, you can start exploring these new capabilities today. The Product Team is interested in your thoughts and ideas as you explore. Influence the direction of future releases. Visit us and leave a comment via the Esri Community.
Still new to the product? Check out our new learn lesson and articles:
- Learn Lesson: Assess hail damage with satellite imagery
- Article: Guide to Sharing Imagery
- Article: Raster Analytics & Deep Learning
- Article: Image Analysis: Which ArcGIS deployment is best?
- Story Map: Pre-trained Deep Learning Models available in ArcGIS Living Atlas. (Note: Most of these models can be run using ArcGIS Image Online).
Are you still exploring what ArcGIS Image for ArcGIS Online can do for you? Watch a demo and see what others are saying about the product, such as Skytec, LLC, the City of Johns Creek, and the City of Yakima.


Commenting is not enabled for this article.