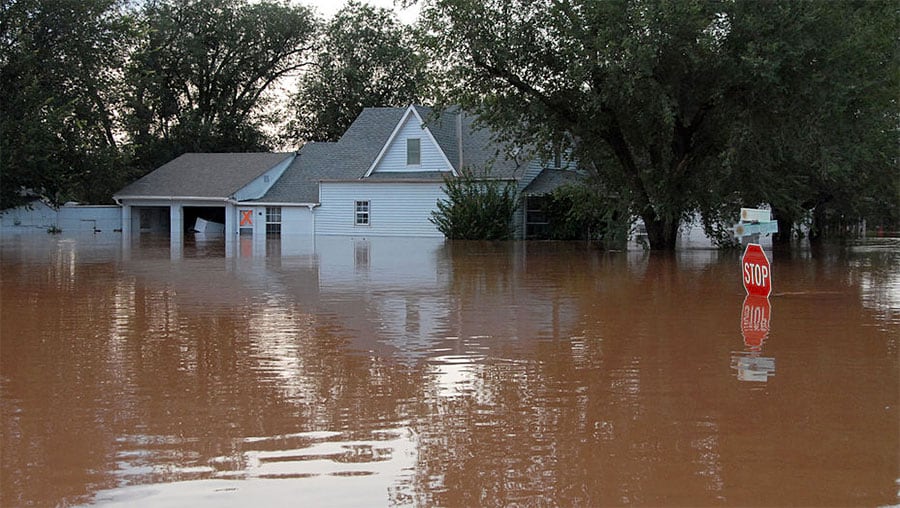
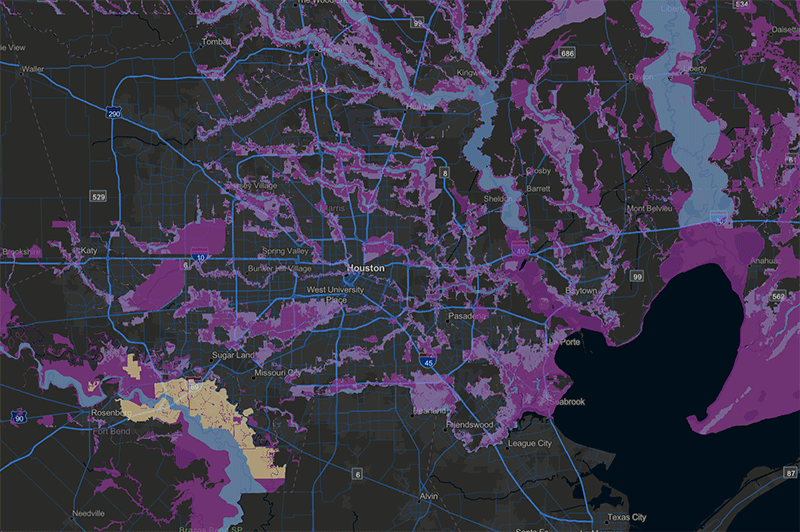
For a homeowner, learning that you live in a floodplain can be terrifying, especially if there’s a major hurricane heading your way, like we have seen all too often.

For a GIS professional, having to develop a hosted feature service with 2.5 million features can be almost as terrifying. But as a part of the Living Atlas team, that is part of what we do every day.
Recently, we updated the USA Flood Hazard service, which is the official FEMA database of flood risk in the United States, to include both an image service and a hosted feature service.
Why both?
The image service provides faster rendering for visualization and basic mapping applications. The hosted feature service provides access to the many attributes associated with any polygon – in this case, details about flood risk. However, the more complex the features, the slower the web service responds. Fortunately, improvements in the performance of ArcGIS Server can now handle the demands of such a large and complex dataset.
This blog provides our basic workflow for deploying a complex feature service.

Clean up the attribute table to reduce what needs to be served
- Make the length of text fields as short as possible.
- Use integers instead of floating point whenever possible. For example, 2.45 m could be converted to an integer of 245 cm.
- Remove unnecessary fields. And while you’re at it, make sure the fields have understandable aliases.
- Set resolution and tolerance values to integers of an appropriate scale. In other words, do you really need 50.5 cm tolerance? For the Flood Hazards, resolution was set to 1 m and tolerance to 2 m.
- Remove unneeded classes. In this example, we deleted several classes that were all some variation of No Data or areas with no flood risk – features that would be extraneous in almost any analysis. The imagery layer still has all of them for the rare cases when someone would need them.
- Use the Check Geometry tools to identify issues. The tool produces a table that can be joined to the feature class to identify bad features. Then use Repair Geometry to fix those errors. You may need to run the tool more than once. These tools can cause changes to the polygon shapes, so check the results.
- Choose the correct coordinate system. Since most users will access the map online in Web Mercator, we publish the service in that standard – otherwise the server needs to reproject on-the-fly.
Publishing the Service
No one can expect a 10 GB service to publish in a few minutes. But sometimes the publishing process seems to drag on indefinitely. Here’s a trick to get everything to load:
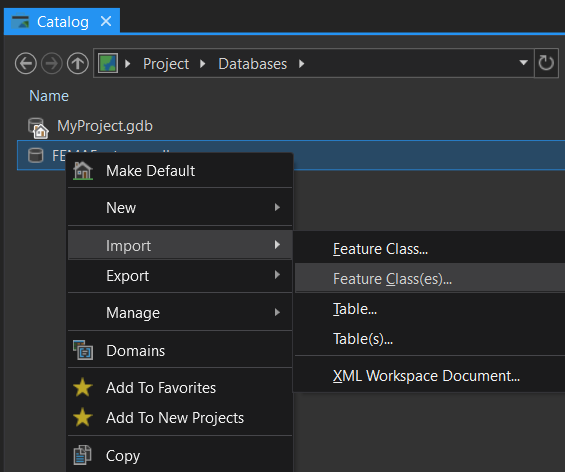
- Create a new file geodatabase in your Catalog pane.
- Load the feature class into the empty file geodatabase.

- Go to ArcGIS Online. Click on Content > Add Item > From my computer. Browse to and select the zipped GDB.
- In the Contents dropdown select File Geodatabase and leave the Publish this file as a hosted layer box checked.
- Add the title and tag information.
Optimize the Settings
- Adjust the Cache as needed. Since this particular service is only updated a few times a year, we chose 1 hour.
- Check Optimize Layer Drawing and Save.
Original FEMA data source: 13.5 GB; 2.5 million features
USA Flood Hazards in the Living Atlas: 6.8 GB; 2.1 million features
Configure the Web Map
One trick in getting a performant web map or app is relying on the strengths of both the image service at coarse resolution and the feature service at higher zoom levels. We adjust the Set Visibility Range of both layers in the web map so that they appear/disappear at the optimal scale. Figuring out the zoom level takes a bit of trial and error, but once you figure out the Goldilocks, you’ll have the best of both worlds.
Check out the USA Flood Hazards web map that combines both the image service and hosted feature service. Please take note that while FEMA updates their database on a daily basis with slight improvements, our services are currently updated every 6 months. For the most up-to-date version of the FEMA flood maps, please visit their National Flood Hazard Layer Viewer.
Besides working with the layers in ArcGIS Online, you can also use the Copy Features tools in ArcGIS Pro and then run spatial analytics.
Do you have questions or comments about this blog? Post them in our GeoNet.
Also, thanks to Rich Nauman and Michael Dangermond on the Living Atlas team for developing this workflow and publishing the services.

Commenting is not enabled for this article.