This blog article was originally published on December 17, 2020, and was previously updated on January 21, 2024.
In the news: According to the National Weather Service and other news services, over 60 million people are currently under heat alerts, including extreme heat warnings, heat watches, and heat advisories. A heat dome is expected to strengthen over the Mississippi and Ohio valleys, bringing triple-digit temperatures from Kansas to Mississippi. Some major cities currently under heat alerts include New Orleans; Memphis, Tennessee; Little Rock, Arkansas; St. Louis; Kansas City, Missouri; Chicago and Minneapolis. Mobile, Alabama, and Pensacola, Florida, are expected to set record highs.

While heat is currently in the news, other newsworthy weather events can occur at any time throughout the year. Follow the steps below to create your own weather-specific maps that focus on the weather events you are interested in.
Make a weather map
ArcGIS Living Atlas of the World includes authoritative live feeds and other content that helps you learn more about current and predicted weather conditions. In this tutorial we will:
- Add USA Weather Watches and Warnings layers from ArcGIS Living Atlas.
- Make changes to layer visibility to display or hide layers.
- Use filters to further focus the scope of the weather map.
- Improve the map by editing colors and using transparency and other effects.
Follow these steps to make your own weather map in a minute, maybe less.
Step 1 — Sign in to your ArcGIS account and open Map Viewer. There are two ways to add layers from the Content (dark) toolbar:
(1) Click Add, then Browse layers.

(2) Click Layers, then Add.

Step 2 — Choose Living Atlas from the Add layer drop-down.

Step 3 — Enter “weather” in search to locate the USA Weather Watches and Warnings layer. Click [+ Add] to add it to the map.

Step 4 — View the layer information to learn more.
Click the layer card to view the item information pane, providing quick access to the overview, description, details, and more.

To open the full item pages, click View details at the bottom of the pane

Looking at the USA Weather Watches and Warnings details, you can learn that the layer is a live data feed from the National Weather Service containing official weather warnings, watches, and advisory statements for the United States. The layer is updated every five minutes using the Aggregated Live Feeds methodology.
Step 5 — Click the left arrow to return to the Layers pane in the Contents (dark) toolbar.

Step 7 — Click features on the map to view the layer pop-ups.
The USA Weather Watches and Warnings pop-up displays details such as the type of advisory, duration of the advisory, update date and time, and a summary with a link to more information. Note that the layer is a group layer containing other layers.

Congratulations! You’ve created a weather map in well under a minute.
Hide unnecessary layers
In the next steps the layer visibility in the group layer will be changed to display only specific layers. For example, you may not want to display state boundaries, public forecast zones, or coastal and marine zones. You can decide which layers you need; experiment by toggling layer visibility off and on.
Step 8 — Expand the USA Weather Watches and Warnings group layer by clicking the arrow next to the layer name.

USA Weather Watches and Warnings is a group layer containing 11 layers, with four visible by default.
In the Layers pane, you can toggle the visibility for layers or remove unwanted ones. For example, to display only watches and warnings you can hide the Public Forecast Zones, US States and Territories (most Living Atlas basemaps include state and territory boundaries), and Coastal and Offshore Marine Zones.
Hide the highlighted layers shown below.

Below, the map on the left shows the default layer visibility. The map on the right hides the layers noted above.

Apply filters to apply focus
You can use layer filters to limit the visibility of certain features in the map, applying focus on what’s important to you.
Step 9 — View the National Weather Service watch/warning/advisory definitions and decide which you want to focus on. For this example, a filter will be created to focus on those that pertain to heat, but you can choose different filters to apply focus to the weather events of your choosing.
Step 10 — In the Layers pane, select Events Ordered by Size and Severity. When a layer is selected, it is highlighted with a vertical blue bar.

Step 11 — Click Filter in the Settings (light) toolbar on the right, then click Add new.

To isolate on heat events, we will add filters to find anything heat related.
Step 12 — Construct a filter expression as follows:
a – Select Type as the attribute from the list.
b – Enter includes as the operator from the drop-down list.
c – Choose all desired values from the dropdown list. You can enter “heat” or other key words to display all the values of interest.

Tip: By default, attributes are listed in order of their Count. You can choose A to Z to make finding specific attributes easier.

Step 13 — Click Save when finished.

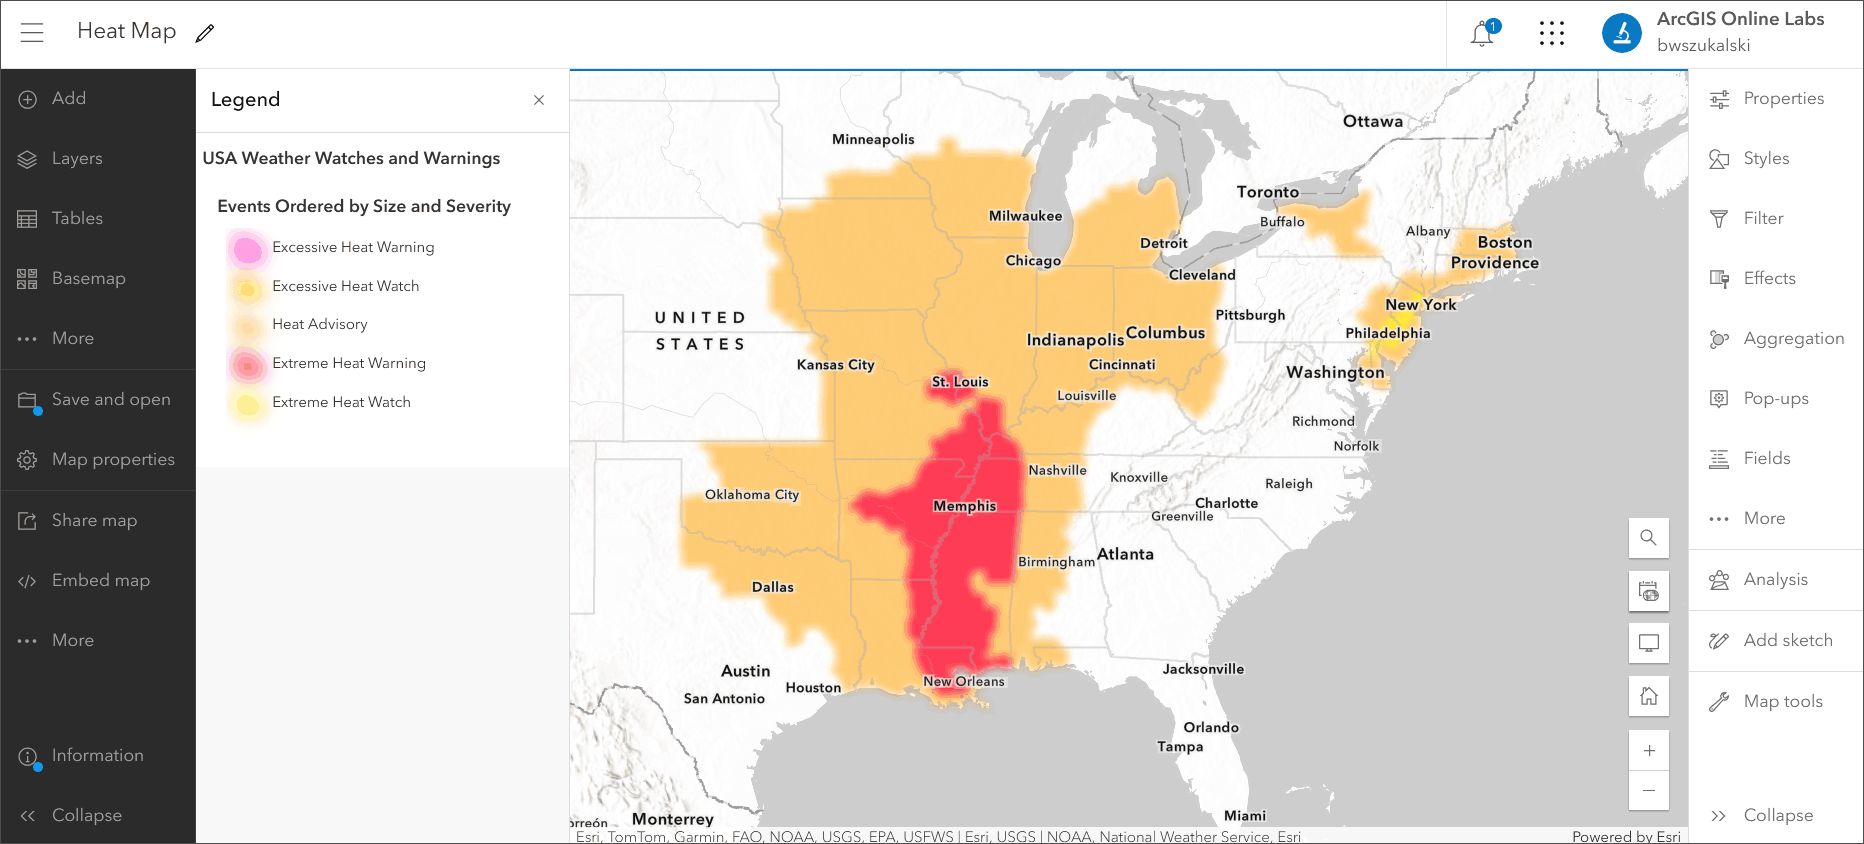
The map shown below is the result of applying the expression constructed above:
Type includes Heat Advisory, Extreme Heat Warning, Extreme Heat Watch, Excessive Heat Watch, Excessive Heat Warning

You can also use operators such as OR and AND in filters. For example:
Type is Severe Thunderstorm Warning OR Type is Small Craft Advisory OR Type is Wind Advisory
Severity is Extreme AND Type is Tornado Warning
Improve the map
Experiment using different basemaps and layer settings until you get the desired result. For layers such as Weather Watches and Warnings that draw above underlying features, a basemap with reference layers that draw on top of the layer (such as Human Geography) is a good choice. You can also change the weather layer settings, such as changing colors or adding effects, to achieve the desired results.
Compare the map shown below with the map shown in Step 13 above.
To improve the original map, a few simple changes were made as follows:
- Basemap changed to Human Geography (Terrain): This basemap includes a reference layer which sits atop other layers and offers a clean look.
- Layer color changes: The Events Ordered by Size and Severity layer style was changed to show heat events ranging in color from red to yellow to orange.
- Layer effects: Saturation and blur effects were added to the Events Ordered by Size and Severity layer. Blur was used to soften the heat event outlines, since heat is not constrained by forecast zone boundaries. This shows a degree of uncertainty.
- Layer transparency was adjusted to 25%.
More information
There are other weather related maps, apps, and layers you can explore. Browse Living Atlas to find more.
For more information, see the following:
- ArcGIS Living Atlas (Website)
- Use effects (Help)
- Filter by Attributes (Help)

Commenting is not enabled for this article.