ArcGIS is a powerful tool for understanding and addressing key challenges in our world, such as social equity, human rights, sustainability, and climate change. Esri offers a variety of documentation and learning resources, including free tutorials, to inspire, empower, and help customers successfully use ArcGIS to address some of the most challenging and widespread problems affecting the planet.
A new ArcGIS Online tutorial focusing on intimate partner violence rates in Canada is just one example of the role ArcGIS can play in examining real-world issues and effecting change. According to a 2021 World Health Organization (WHO) fact sheet, violence against women, which includes intimate partner violence and non-partner sexual violence, constitutes a “major public health problem and a violation of women’s human rights.” An estimated 30% of women worldwide have experienced either intimate partner violence or non-partner sexual violence in their lifetime, with intimate partner violence being the most prevalent.

Maps and charts can help us better understand geospatial patterns in intimate partner violence data, including where rates are highest in a country, region, or worldwide. This can assist decision-makers in identifying where services such as domestic violence shelters are most needed to support intimate partner violence survivors and their children.
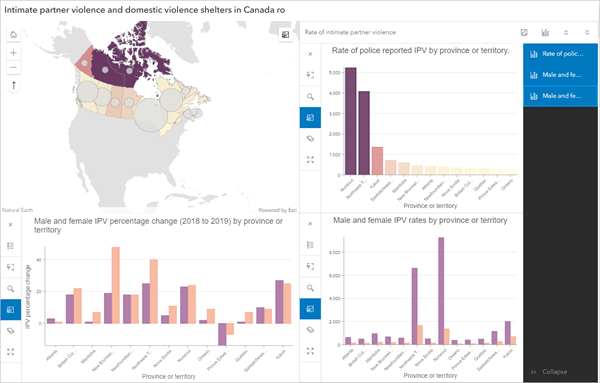
The Map and chart data tutorial guides users to visualize and explore intimate partner violence and domestic violence shelter capacity across Canada. It uses charts, smart mapping, and other visualization and analysis tools in ArcGIS Online Map Viewer, and the final map is shared as an app using ArcGIS Instant Apps.
By following the tutorial’s step-by-step workflow, you’ll learn how to do the following:
- Import .csv files into ArcGIS Online and join the data to a feature layer so you can visualize it.
- Symbolize layers to highlight and reveal patterns in the data.
- Configure and customize pop-ups to show specific information about the features.
- Create charts to provide deeper insights.
- Share your map as an instant app using a chart-centric template.
Ready to learn more? Explore the curated gallery of tutorials that show how to solve real-world problems and better understand the world through GIS.

Article Discussion: