Joining data together to visualize and understand trends is nothing new for GIS savvy individuals. In fact, if you’re following good database design you’ll often find it handy to visualize information based on data in a related table like pumping test results from a hydrant inspection.
For a while now, the Join Features analysis tool in ArcGIS Online has made it possible to join data together and create a new feature layer based on spatial or attribute relationships. This approach works great if you are working with data that is static and doesn’t change. However, if you are working with data that is being modified or added to over time, that feature layer quickly becomes out of date and you need to periodically run the Join Features tool again to get the latest information. What you really need in this case is to combine some of the flexible functionality of hosted feature layer views with your joined data to create a dynamic up-to-date view of your related data.
With the June release of ArcGIS Online, we’re starting to introduce just that for some specific workflows within Join Features (more options will make their way into future releases). This new functionality is available if you are:
- The owner of both the Target and the Join layer (hosted feature layers)
- Performing an attribute-based join
- Performing a one-to-one join
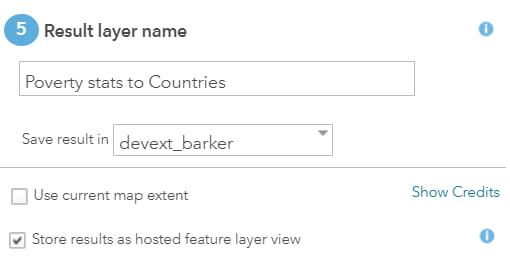
If these apply to you, you now have the option to Store results as hosted feature layer view. When this option is checked, the tool creates a new hosted feature layer view based on the Join Features parameters. This means that view is always up to date as the data changes, and you no longer need to re-run the tool as your data changes.
An added bonus is that you won’t use credits because the data isn’t duplicated. The ability to store results as a hosted feature layer view really shines in the use cases described below.
Joining data even when you know it might be a bit messy
Real data can be messy, and any time you’re joining data together from two different sources you’re likely to have some features that don’t match because of small differences in values and spelling. By saving the results of the join as a view, you can interactively correct the data because everything is dynamic. Fix a spelling mistake in one of the original datasets and your view will update to show the new results.
Visualize measurements and statistics in related records
A long-standing request from many of you is to make it easier to visualize information stored in related records. By using the Join Features tool, you can now create view layers with dynamic statistics for numeric fields (support for dates coming in the future). This works well when you’re trying to understand and visualize information such as water quality sampling where you are taking multiple readings at the same location.
Things to consider
Any time data is joined on the fly there are some performance considerations to keep in mind. The larger the data and the more fields a layer has, the slower the performance. If you’re working with large and complex data, it still may be a better idea to periodically create a new layer based on the join, instead of creating a view layer, to get the best performance in high-volume situations. Additionally, feature layers that participate in view layers with joins cannot have their schema altered and are always read-only and cannot be used offline.
What’s next
While this feature is exciting, there’s so much more we want to do. In future releases, we are looking to expand the workflows supported for this new feature and give you more flexibility and options for joining data together.

Commenting is not enabled for this article.