At the ArcGIS Pro 2.1 release, significant new functionality has been added regarding visualizing Scene Layers in ArcGIS Pro. Let’s look at some of the new functionality!
When you add a point or 3d object scene layer to ArcGIS Pro one of the new things that you will notice is the Data tab. Within the Data tab we have added a Definition Query, Exclusion and Selection group. Let’s look at what each of these do:
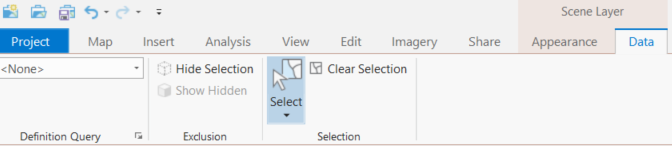
Selection
Within the Selection group you can select features within the scene layer as well as clear selected features. The select dropdown includes the standard select by rectangle, line, circle etc. This provides a convenient way to select features rather than switching back and forth to the Map tab. The selection is based on the level of detail that the scene layer is displayed at so you may see features appear if you zoom in further. The main purpose for these tools leads to the next bit of functionality…exclusion.
Exclusion
Two new buttons allow you to hide your selection and show hidden features. The purpose of this group is for urban planning workflows where you want to hide buildings and then turn on a new layer representing the proposed building. Another use case is hiding trees that will be cut down and turning on a trees layer of proposed locations.
Note: The selection workflow is intended for a small number of features. If you would like to hide additional features then please use a definition query.
Definition Query
Definition queries can now be set on scene layers. You can set a definition query via the layer properties for the scene layer. Keep in mind that scene layers support standardized queries. The definition query group within the data tab allow you to see what queries have been applied as well as clear the query.
Note: Capabilities of defining a definition query on a scene layer depend on the statistical information available for a scene layer. Statistical information is captured at the moment that a scene layer is generated as a scene layer package (.slpk) file. Changes to a definition query can only be calculated using this statistical information. Scene layers with associated feature layers, which are created when they are shared to ArcGIS Enterprise, have statistical information within them. Therefore, when applying definition queries, the statistical information can be recalculated. Use a scene layer with an associated feature layer when modifications to a definition query needs dynamic statistical information.
Point and 3D Object Symbology
The next set of new functionality surrounds symbology. This functionality will depend on whether you have a scene layer referencing a scene layer package (SLPK) or a service with an associated feature layer.
Two new symbolization methods have been added for point and 3d object scene layers. These are unique values, and unclassed colors. Additionally, transparency attribute driven symbology is supported for 3D object scene layers and transparency, rotation, and size attribute driven symbology are supported for point scene layers. For a breakdown of functionality, take a look at the table for scene layer functionality (both local slpk and hosted services) in ArcGIS Pro.
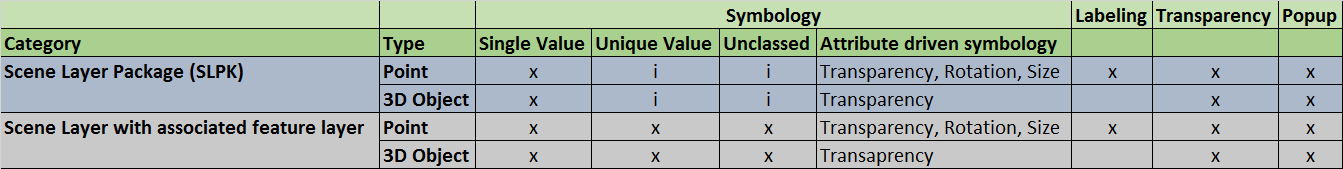
i denotes reliance on statistical information captured in the slpk
For a full rundown of symbology see the following help documents:
3D Object Scene Layer Symbology
Labels
Another feature that you may have not known about is labels for point features. When you have labels enabled on a feature layer and either share them as a web layer or input to the create scene layer package tool, the labels will be cached with the scene layer. The labels can be turned on and off but they cannot be altered as they have been permanently cached with the scene layer.
Point Cloud thinning and scalability
Point cloud scene layers are scalable, allowing you to work with large point cloud datasets efficiently. Displaying very large point sets is generally slow, partially due to hardware limitations. Point cloud scene layers are efficient in that the areas you need to visualize are displayed at an optimized point resolution. The Display Limit and Density allow you to control how many points are displayed.
Display Limit
Applying a display limit sets a size limit to the number of points used to display the point cloud scene layer. The default value is 1,000,000. If, for a given display extent, a point cloud scene layer exceeds the specified point count, the layer switches to be more generalized. If you see a tiling effect when zooming in and out on the point cloud scene layer, considering increasing the display limit or adjusting the point density.
Density
This setting controls the density of points enforced by the point cloud scene layer. You set it interactively by using the slider bar. Move the slider to the left toward Min for a coarse point resolution.
Point Cloud Symbology
There are four symbology display methods to symbolize a point cloud scene layer: Stretch, Classify, Unique Values and RGB. For each method, one of the following attributes may be chosen.
Note: Display method and attributes will depend on whether or not the source data included them.
Point symbology attributes
- Elevation
- Class
- Return
- RGB
- Intensity
For a full list of new features with Scene Layers check out What’s new with Scene Layers in 2.1.

Article Discussion: