Did you hear about this thing that colleges have football teams now? And at the end of the year some committee decides on the four best, and they play each other?
We have to support this or it might not make it. So, in that spirit, I made some maps of the recruitment footprints of all four teams. These footprints are quantified (because I’m a nerd) by something I call the Air Mile Index. Because it is a proxy for how many air miles the assistant coaching staff racks up.
So if you are prepared mentally, and emotionally, to swim through an analysis of these recruitment footprints in the linked Story Map. You can yank a couple of quips from here and spout them off at a game-watching party over some chips and pop…and alienate yourself utterly. Hurry, though, because this particular set of maps has a really limited shelf life.
___
There are details-a-plenty in this steamy Story Map walk-through.
No time for that? Download and dig right in to my Pro project.
___
Here are all 482 player hometowns:
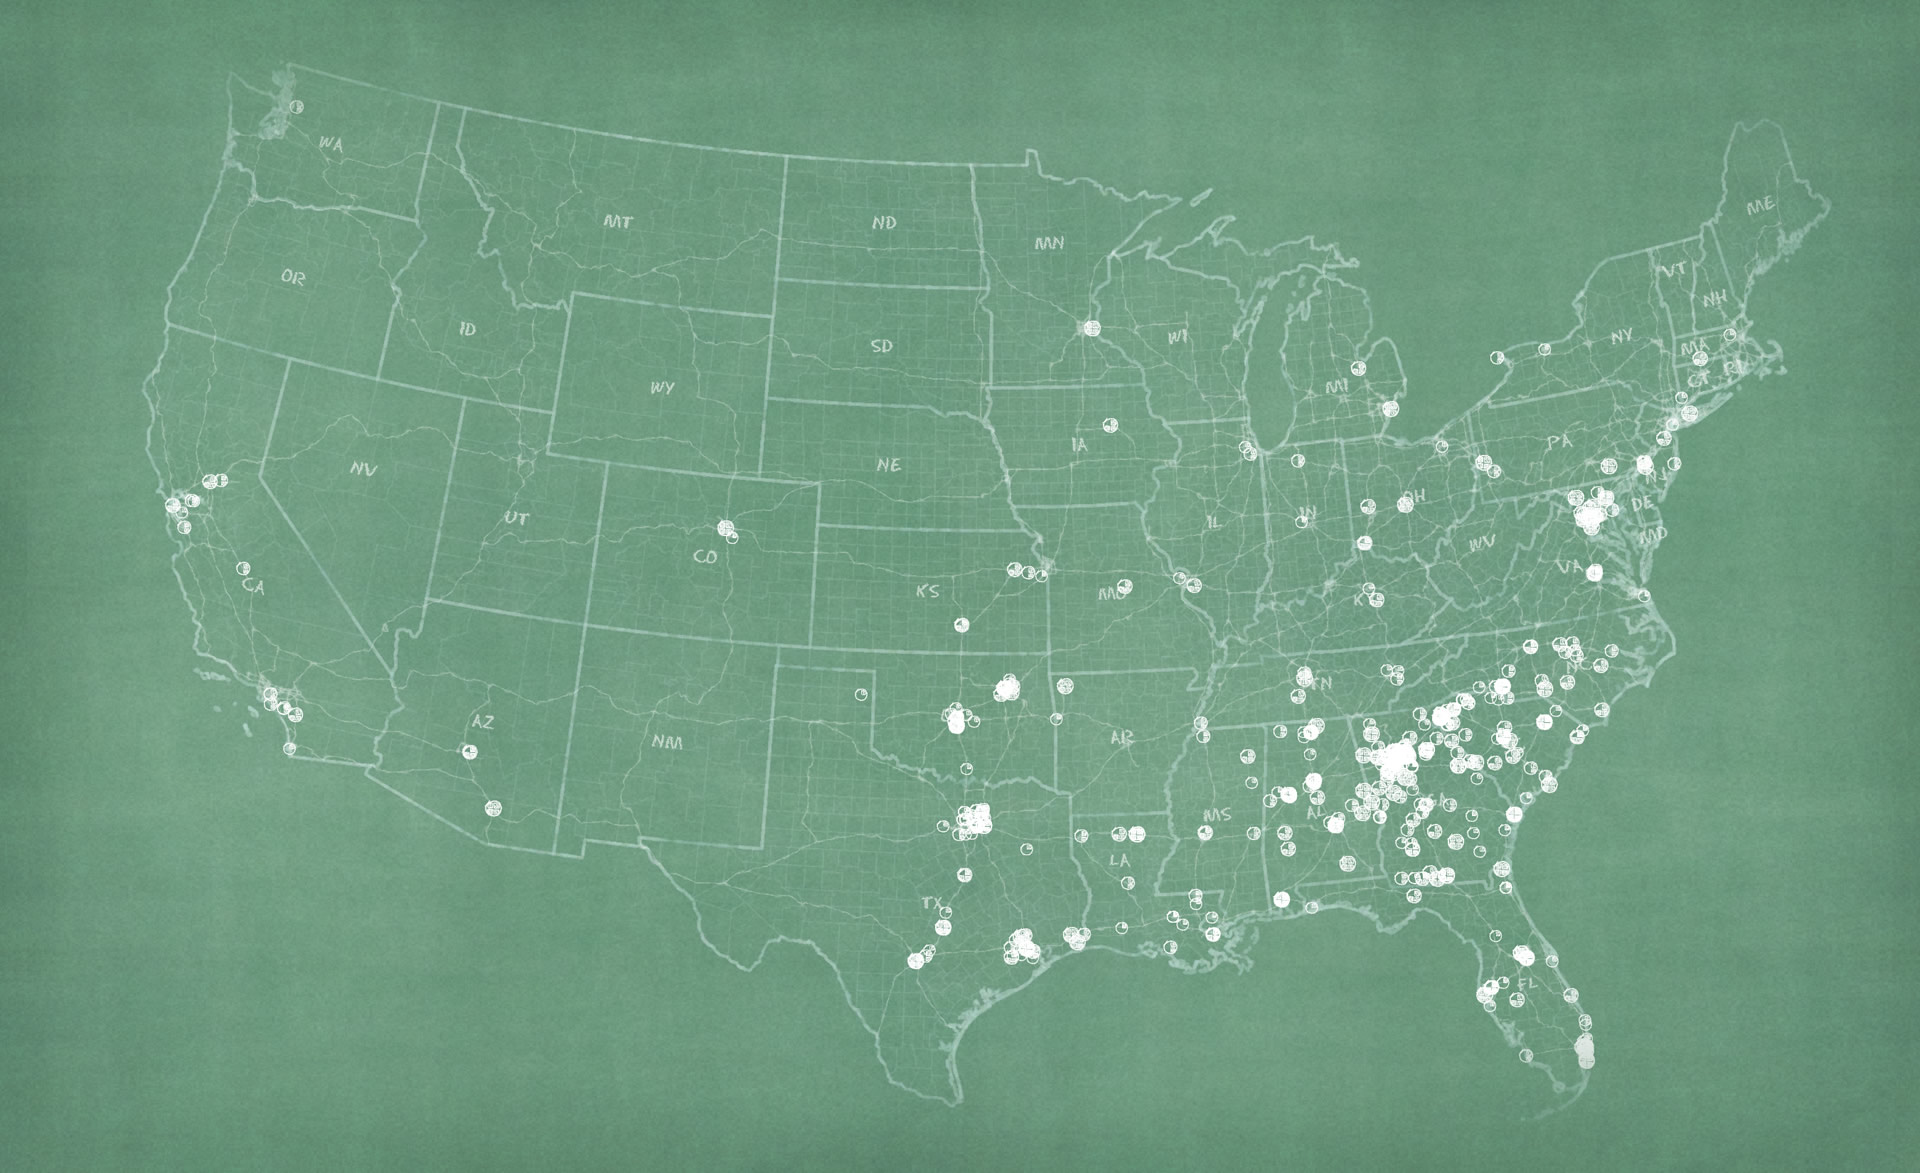
Here’s what those probably-impossibly small dots represent…

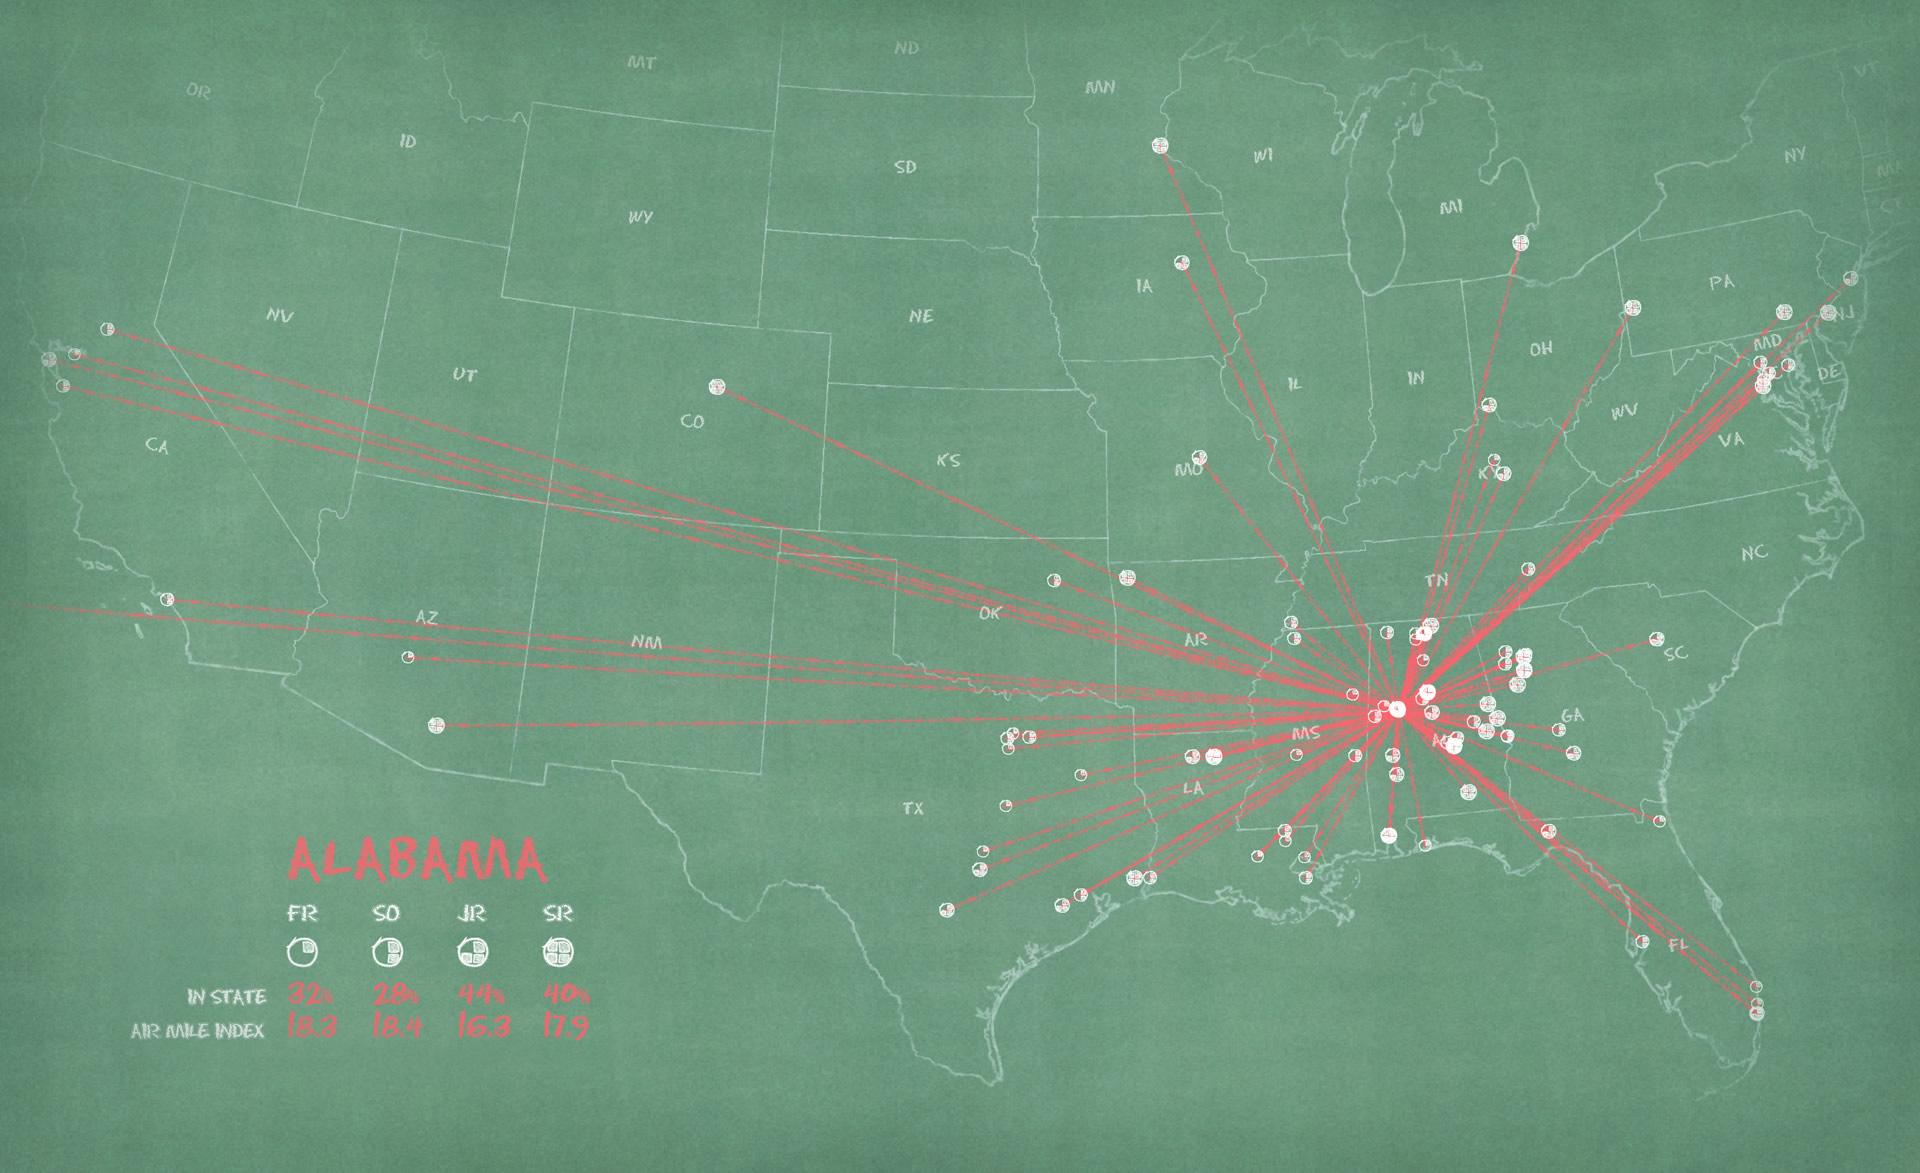
Let’s break it out by school.
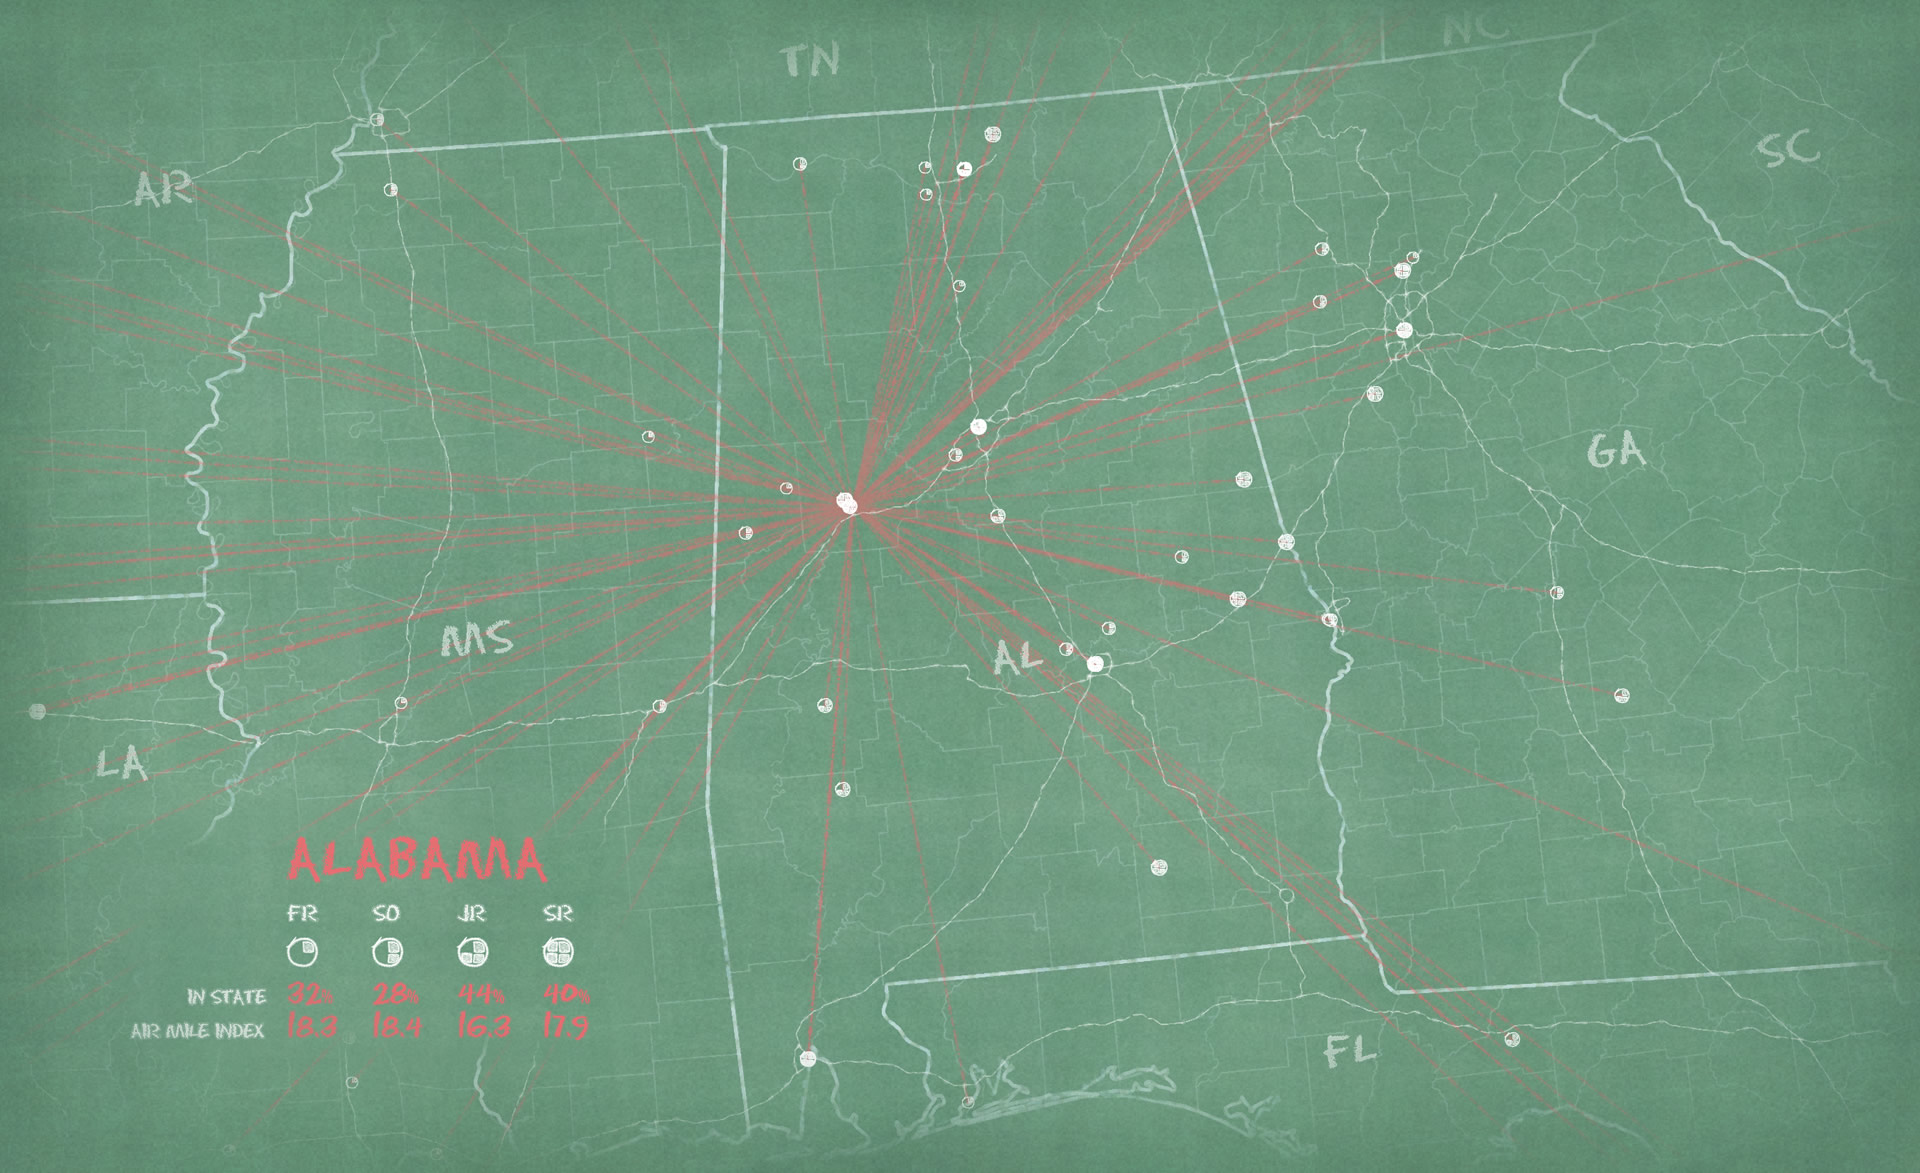
Alabama:
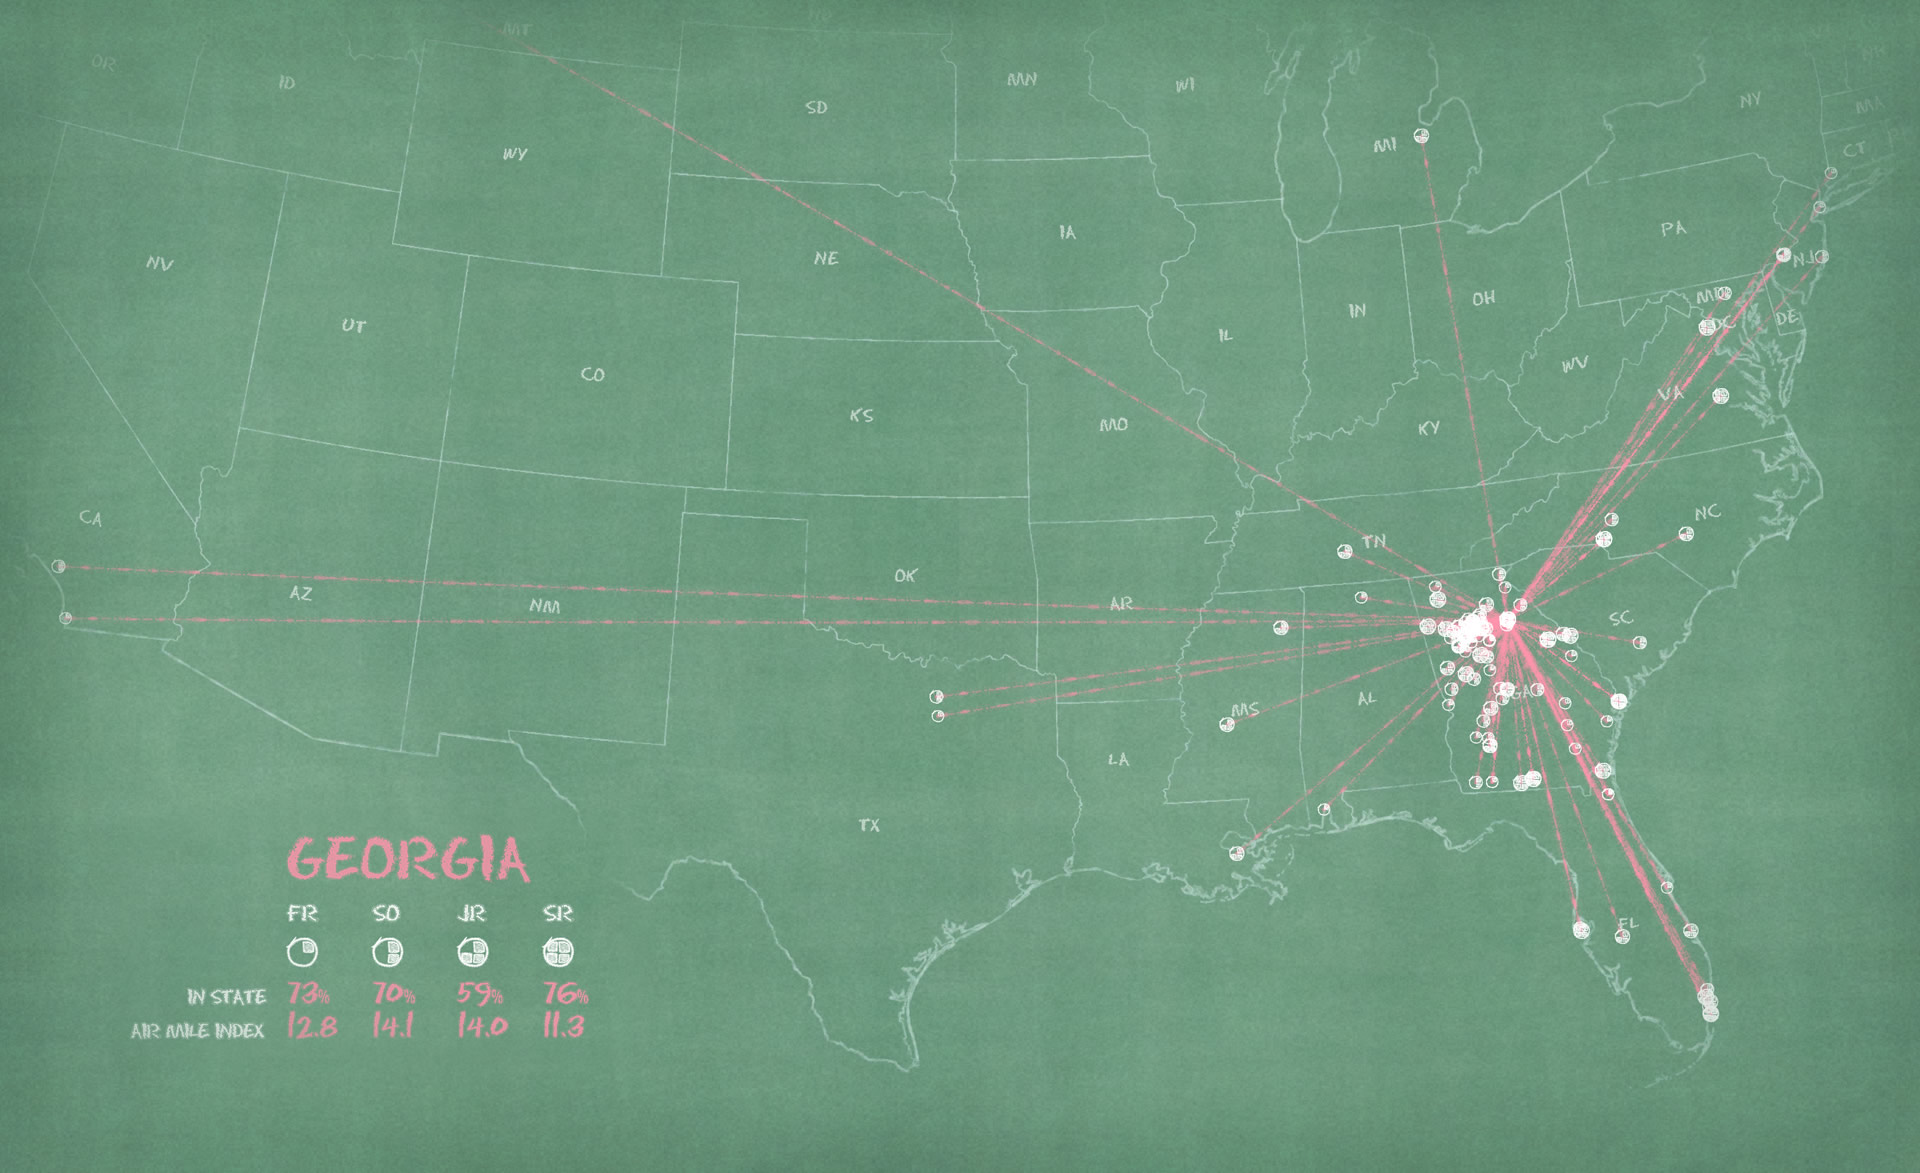
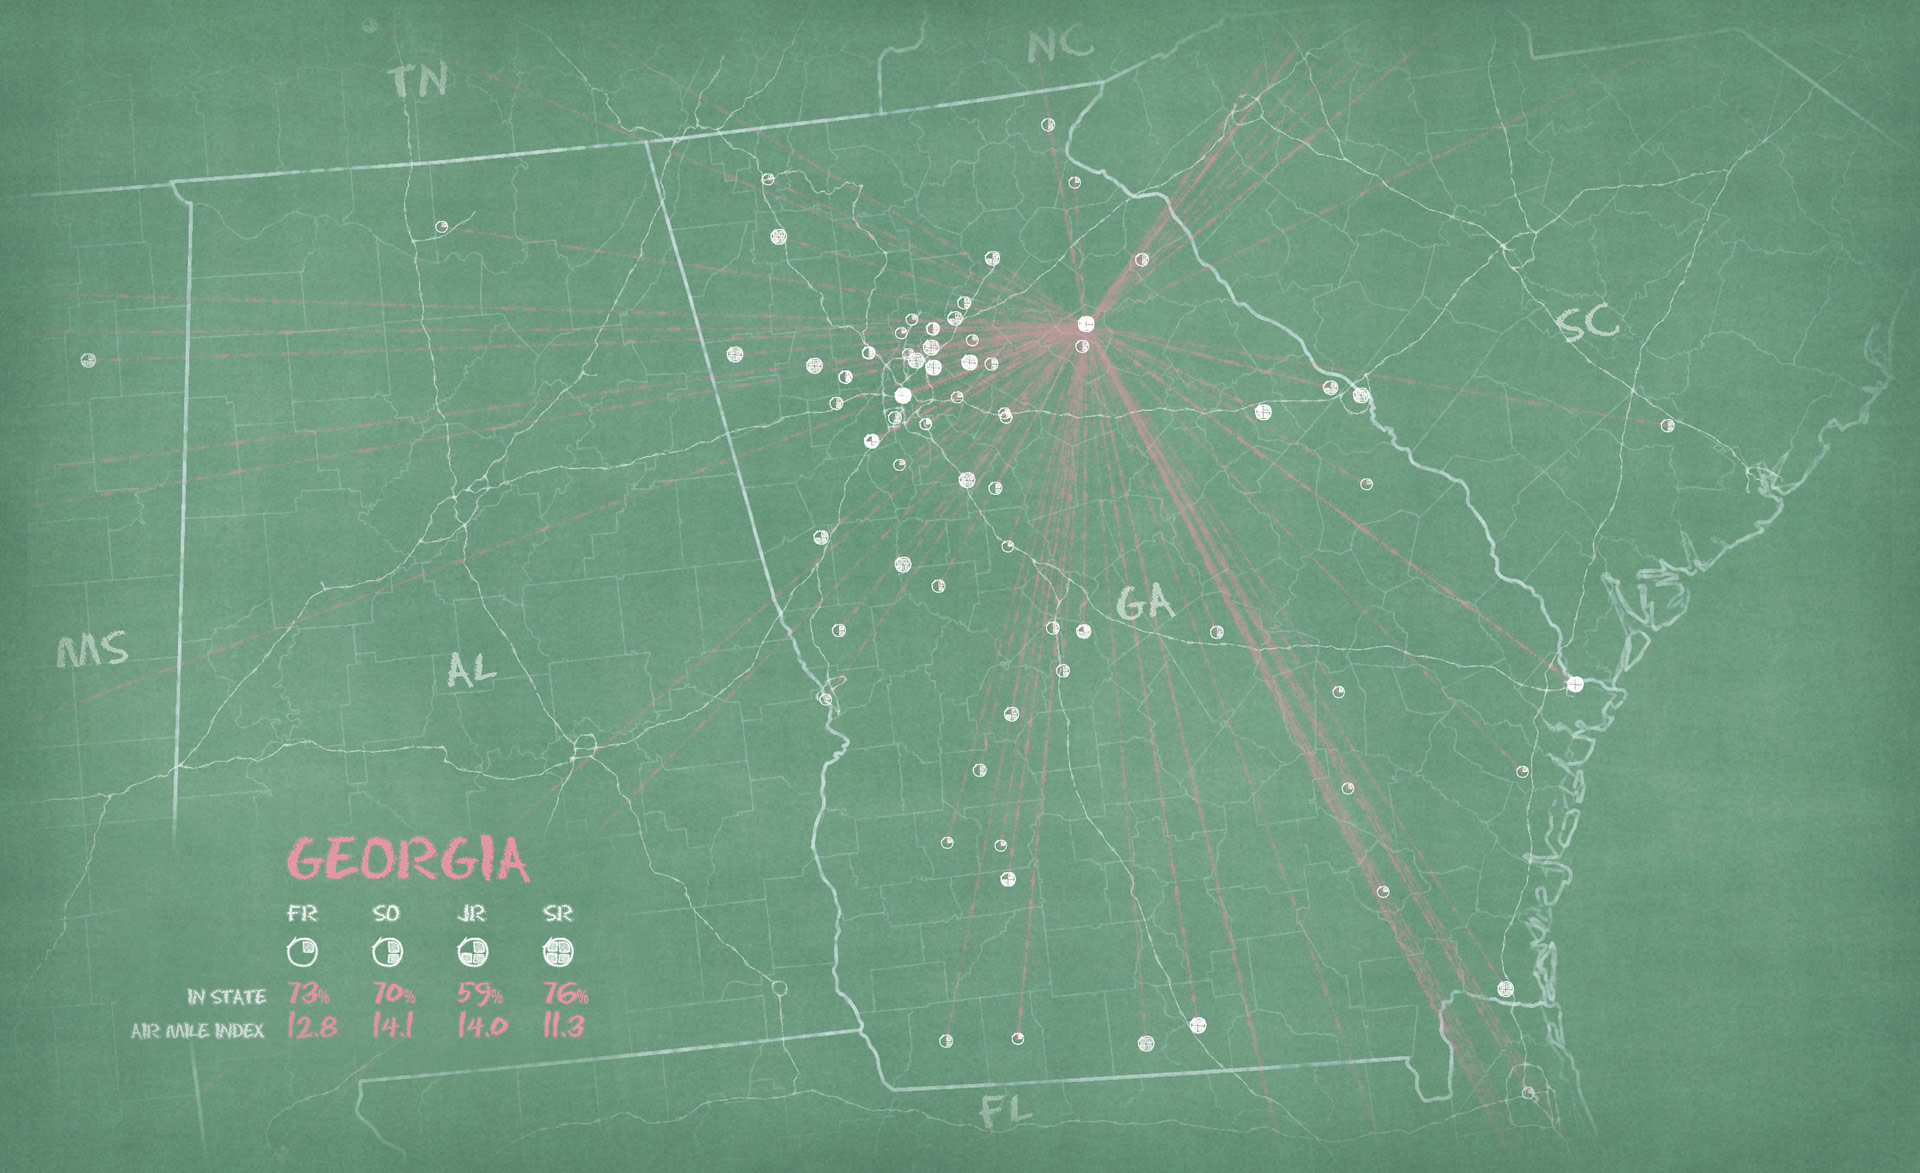
Georgia:
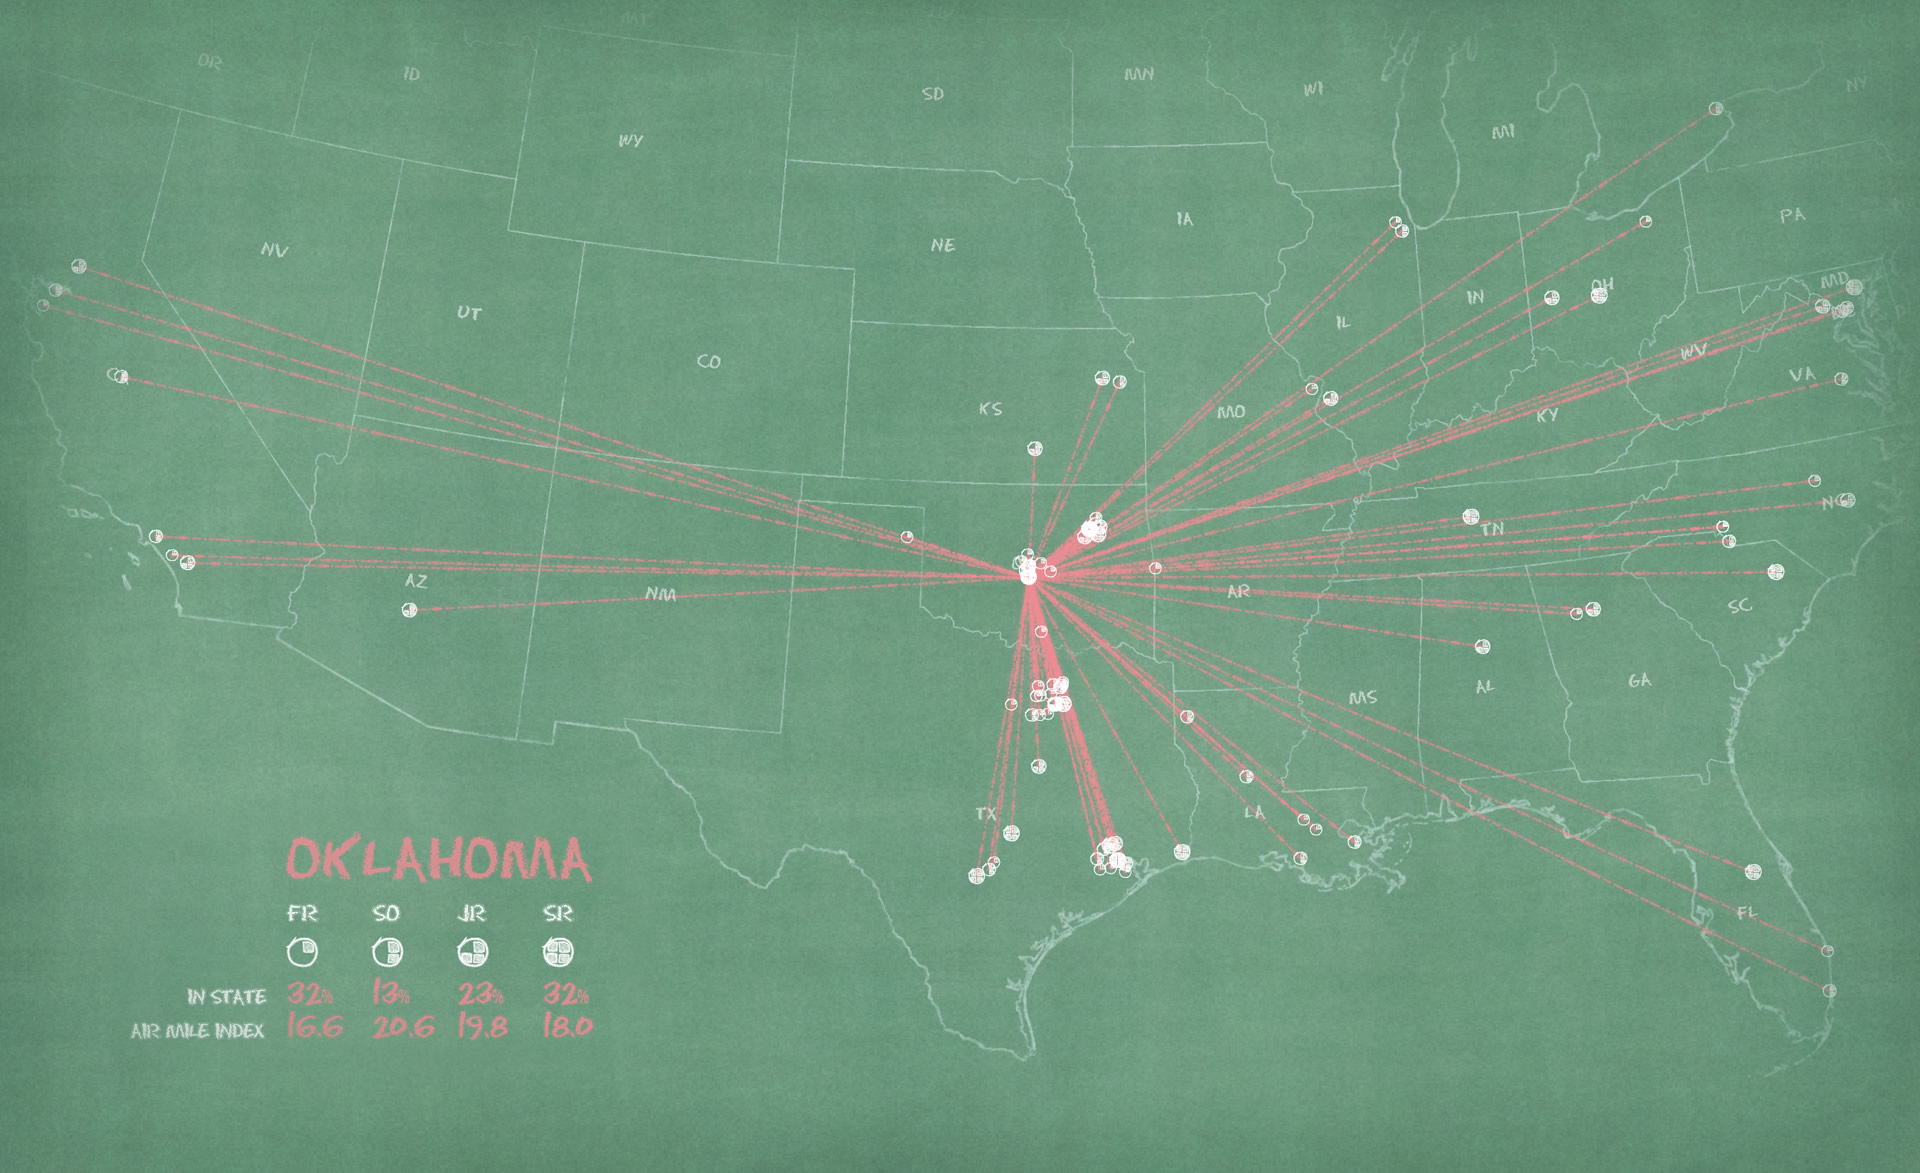
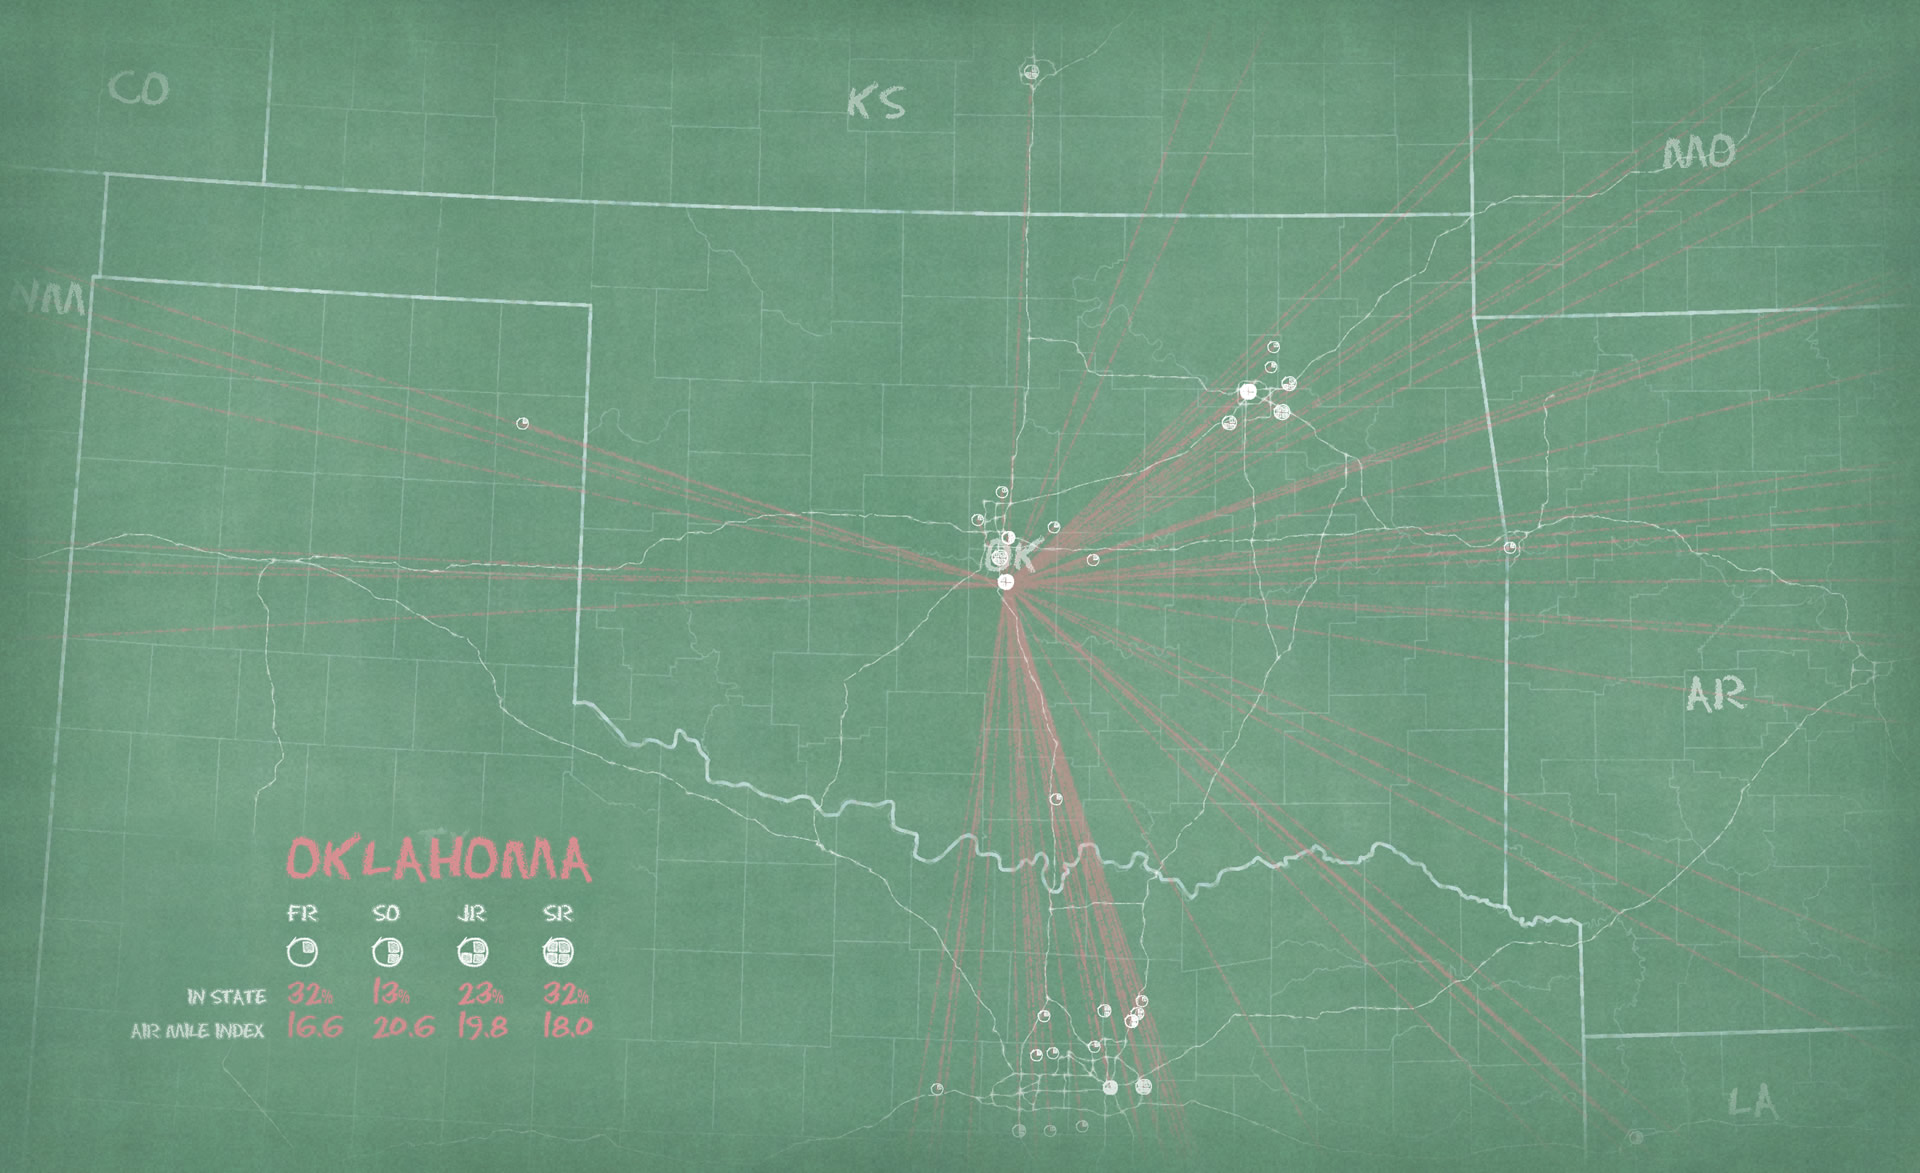
Oklahoma:
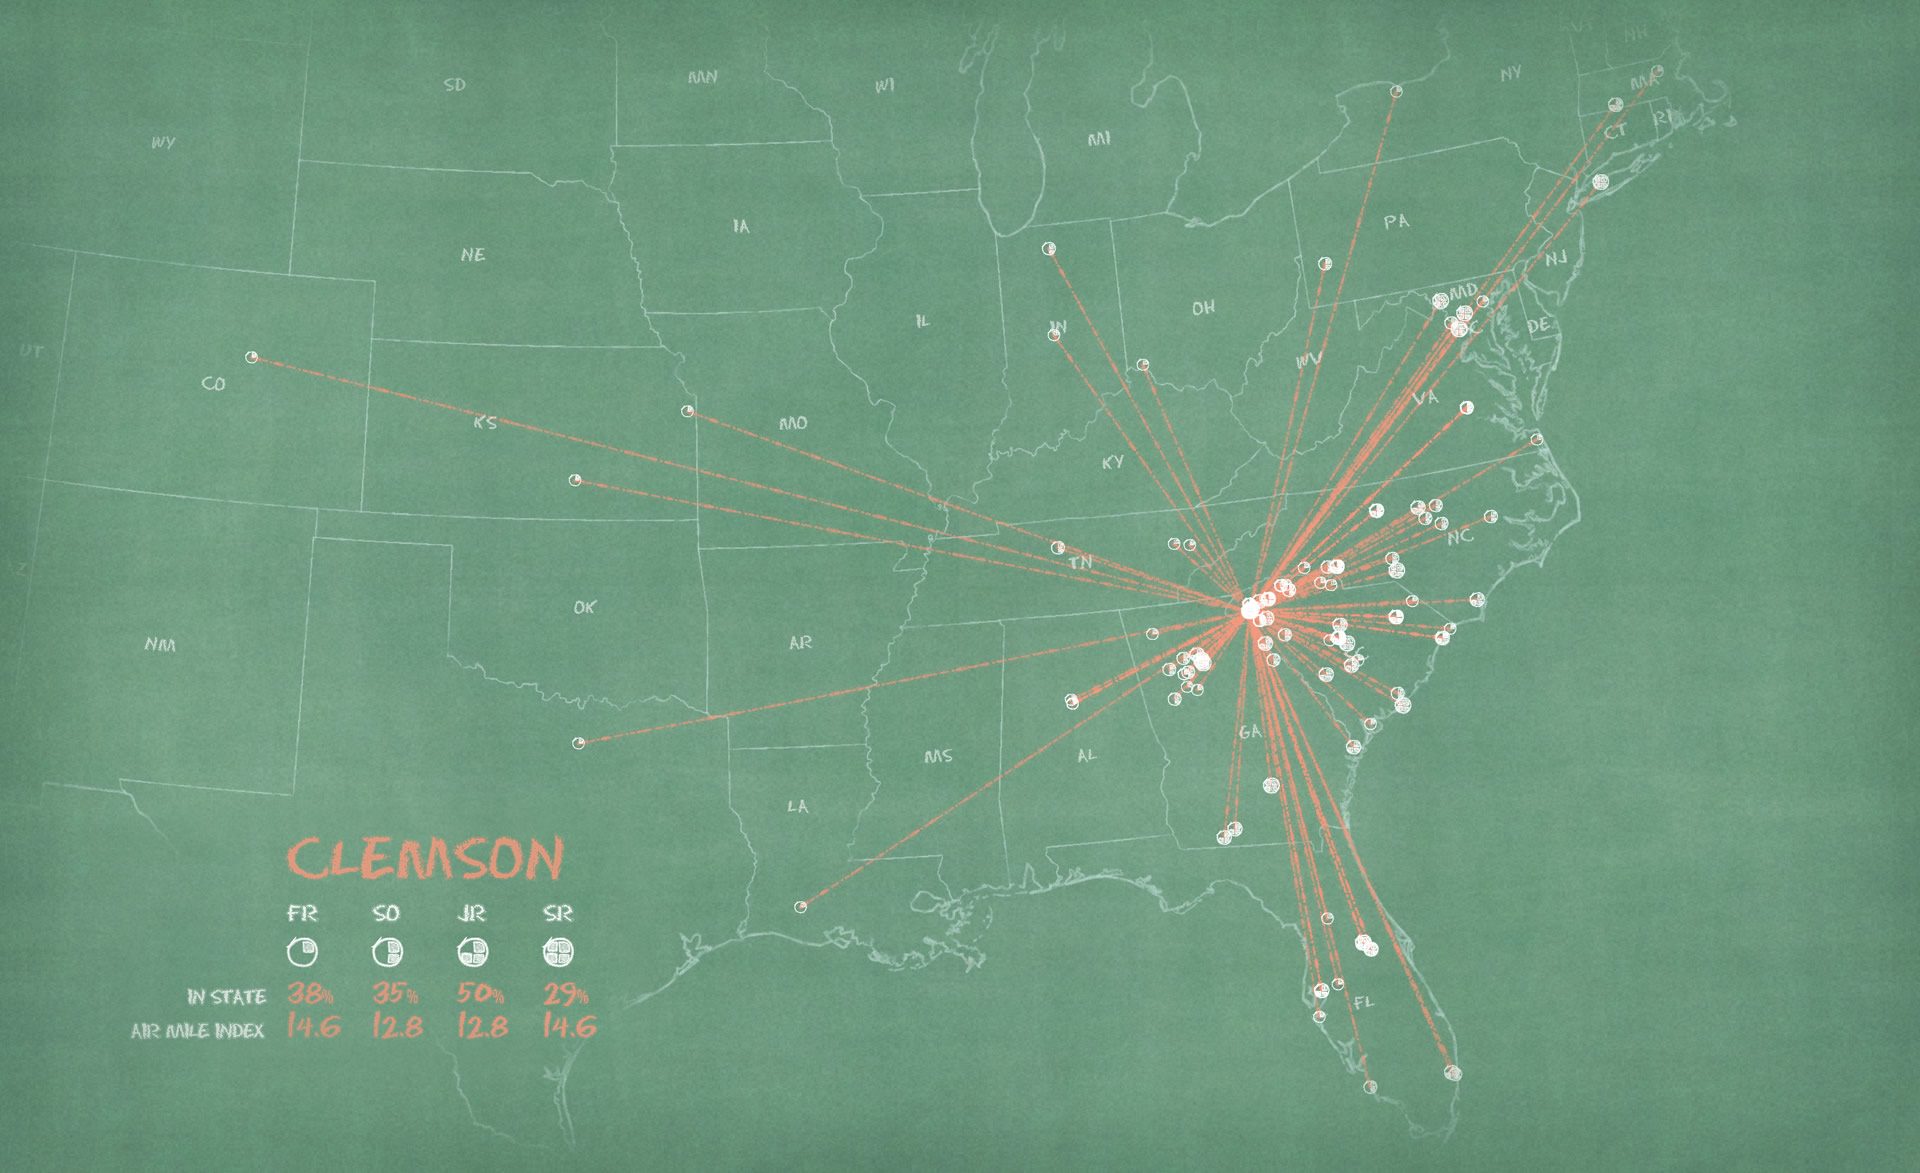
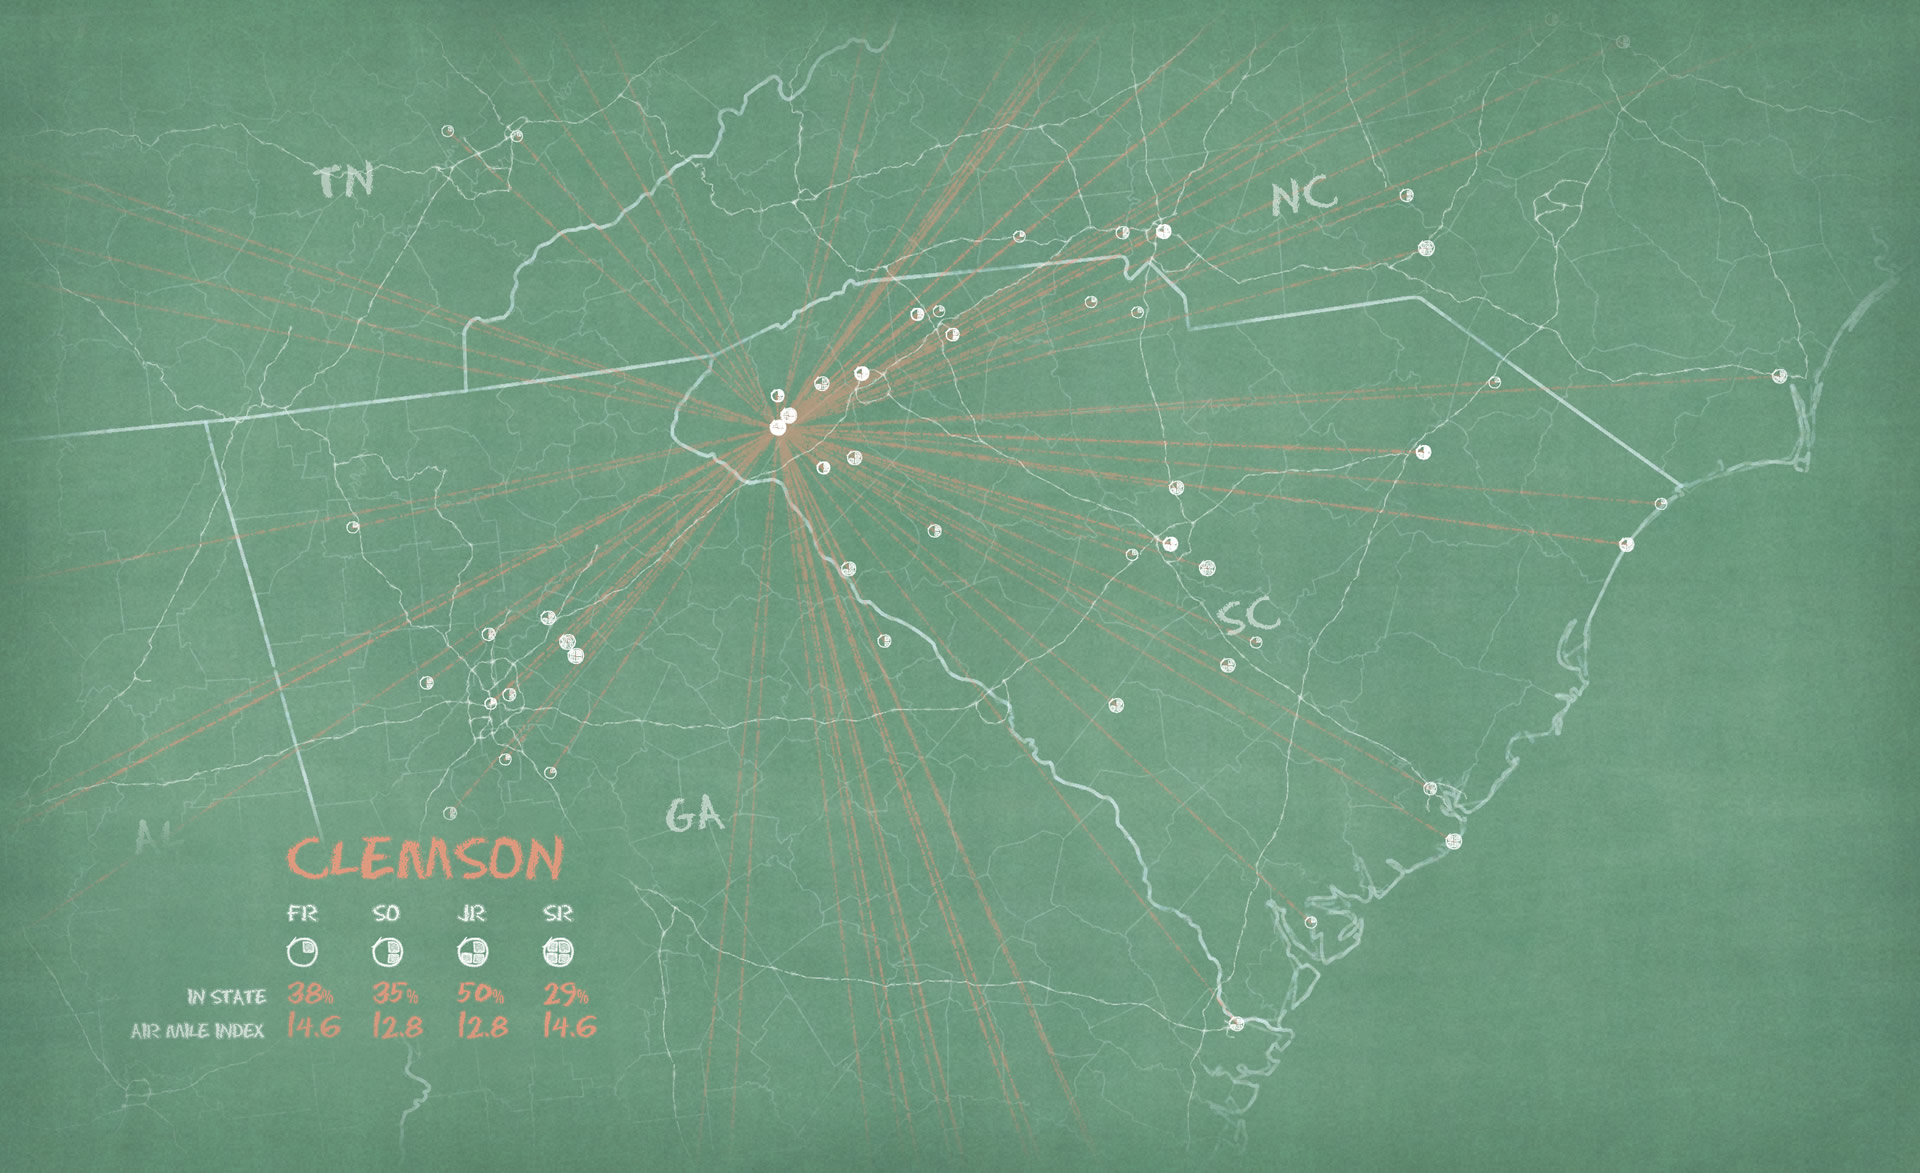
And finally Clemson:
- What in the world is an Air Mile Index? Get ready to live.
- Want to make your own Air Mile Index maps? Check it.
- Who cares about football? You just want chalkboard maps? With faded edges?
- It’s not too late to download this ArcGIS Pro project package.
- Nor is it too late to read the Story Map.
Happy Football Mapping! John


Article Discussion: