We are going to look at the process used to create a link chart. A link chart is a way to visualize relationships between entities in your data. A link chart consists of two main components, entities and relationships. An entity represents people, places, and things, and even concepts such as phone numbers and IP addresses. A relationship is a visual representation of how entities are related/connected.
Link charts are created using the attributes in your data depending on what you want to visualize and how your data is modeled, without requiring complicated schemas or pre-defined ontologies. The data you use can be contained within a single feature layer or multiple feature layers. We will discuss both cases below.
Building a link chart from a single feature layer
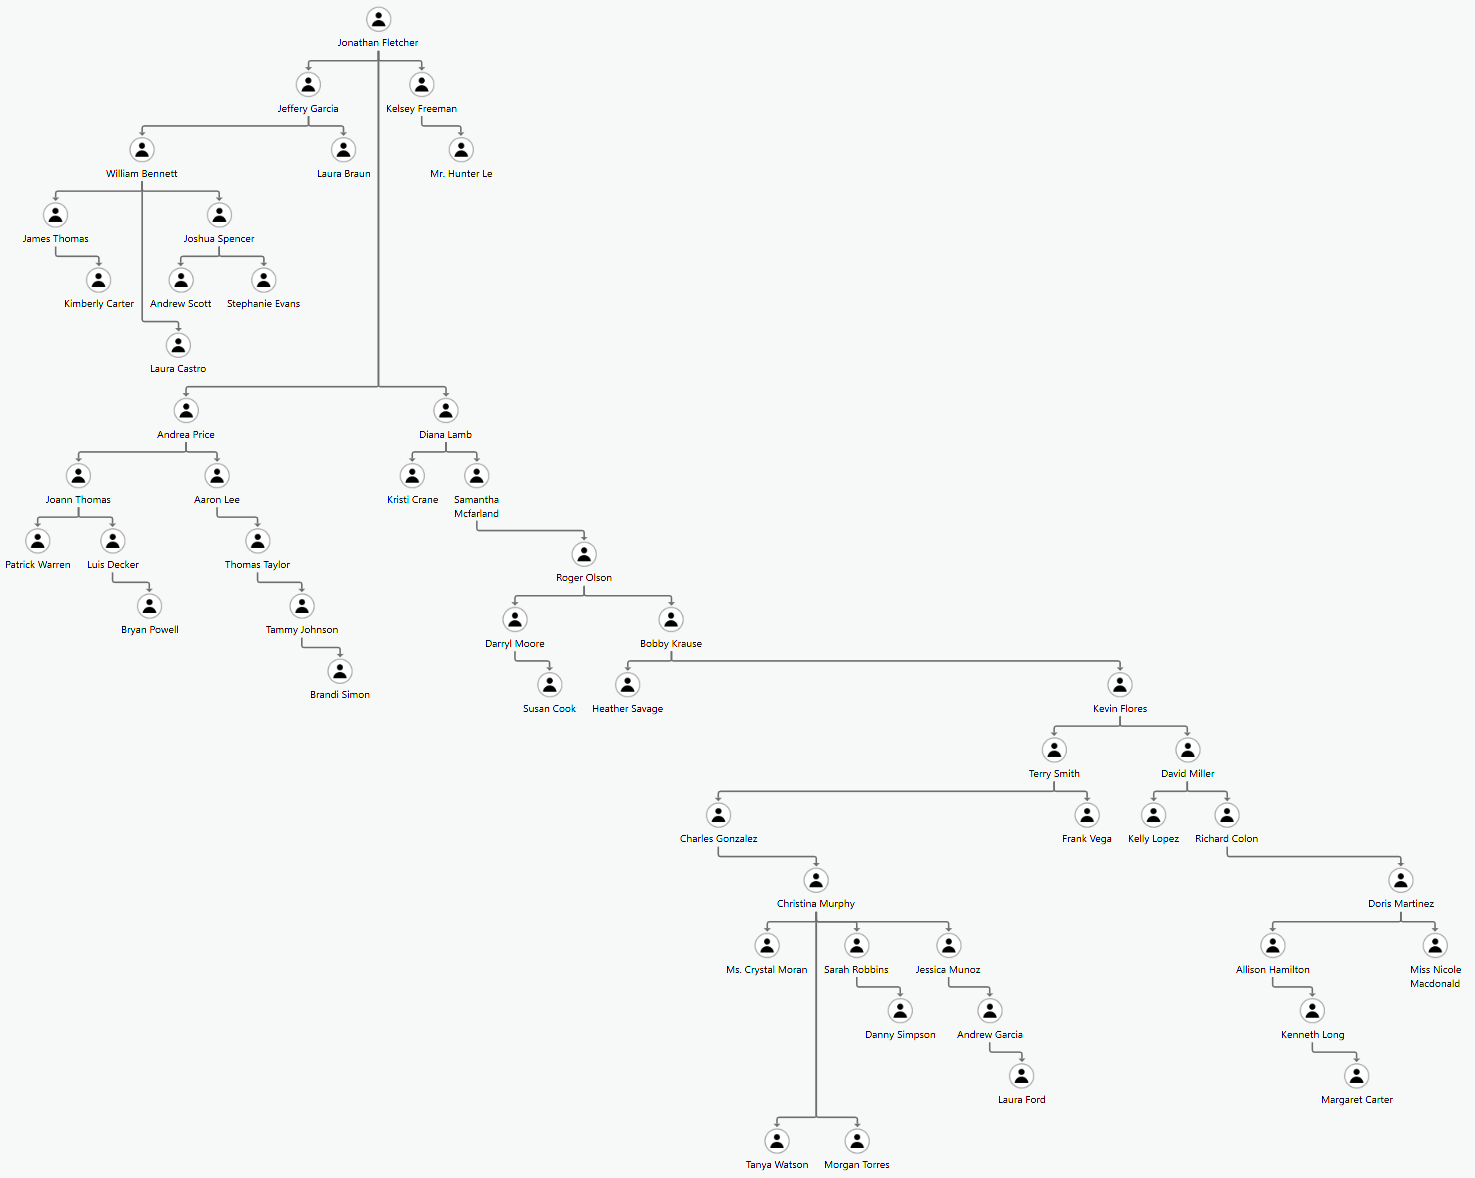
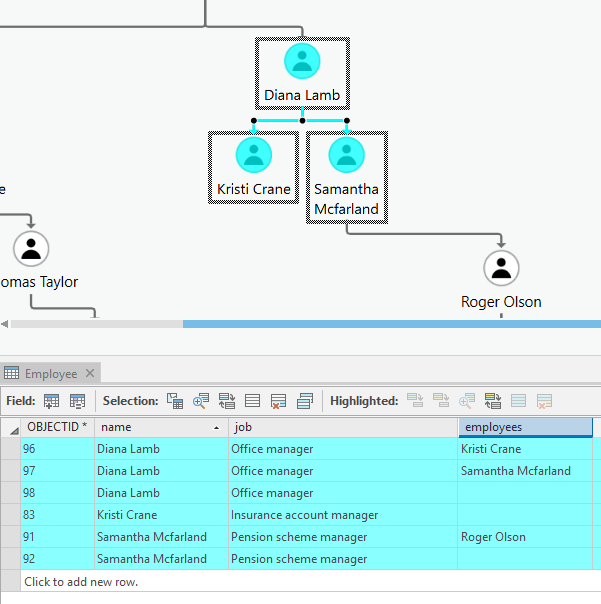
The link chart above shows a typical organizational chart for a fictional company.
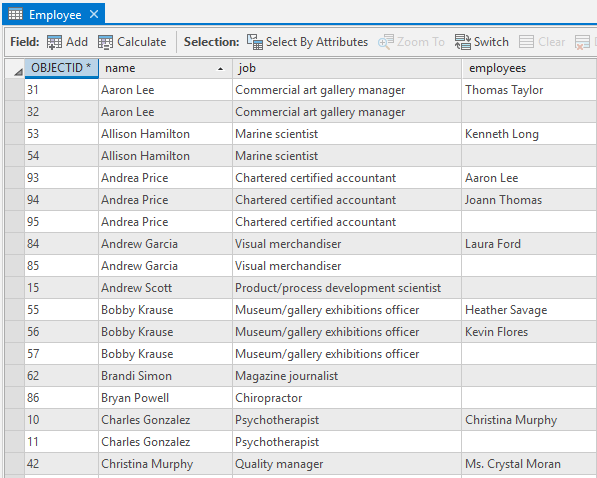
All the employees are entities and the relationships show the hierarchy of the organization. Let’s examine the data to gain a better understanding of how it’s organized. The employee feature layer has each employee’s name stored in the ‘name’ field. Notice that there are some duplicates in the ‘name’ field because these employees have more than one direct report. The ‘employees’ field contains the name of the employee who reports to the individual listed in the ‘name’ field.
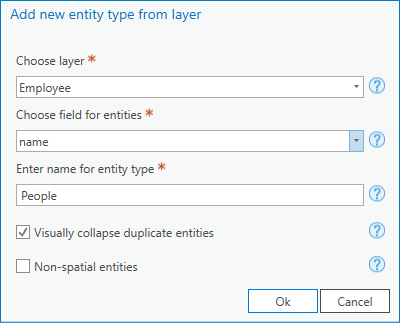
The first step is to create an entity type from a field in your feature layer. In this example:
- The feature layer we’ll use is ‘Employee’.
- The name of the entity type is user-defined; we chose to name this entity type ‘People’.
- We checked the box to collapse duplicate fields so that we don’t have multiple entities of the same person showing up in the link chart.
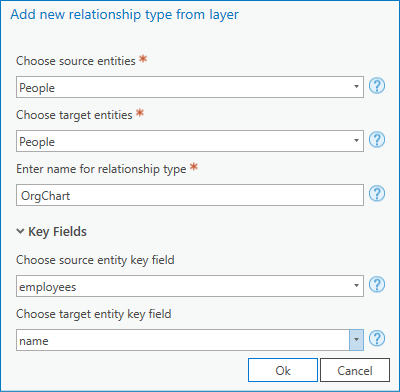
Next, we will create the relationship type to define how the entities are connected in the link chart. In this case we will use one entity type as the source entity and the target entity (later in this article, we’ll walk through how to use different entity types).
- The name is user-defined; we chose to name this relationship type ‘OrgChart’.
- Key fields are used when you have a common key or unique ID within your data that can be used to link the source and target; we used ‘employees’ as the source key field and ‘name’ as the target key field.
When you create a relationship using the key fields you are using attributes to link the entities based on a matching attribute field. In this example, we’ve created a relationship that shows the link between employees and their managers.
Building a link chart from multiple feature layers
In this example, we will use two feature layers to create a link chart that shows the relationships between actors and movies. You can see how the data is organized in the image below:
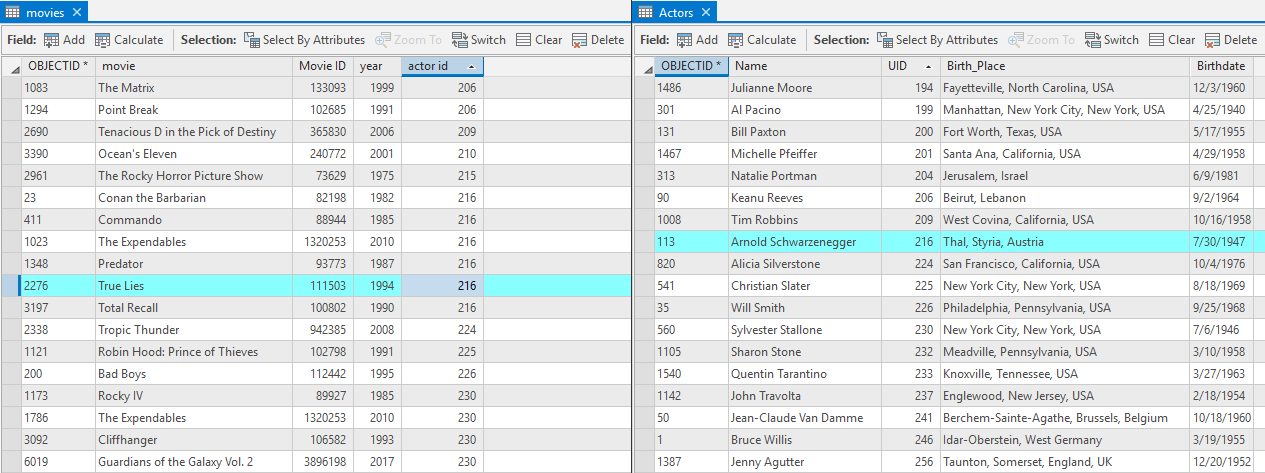
The movies layer, on the left, contains a record for each movie and the actors that were in that movie. Because there is more than one actor per movie, there are duplicates in the movie column. The actors’ identity is stored in this layer by a unique ‘actor id’ field value (this is representative of other unique ids such as social security numbers, cross reference numbers, prisoner ids, etc.). The layer on the right contains the same list of actor ids, in a field named ‘UID’. For example, the selected record for the movie True Lies has an actor id of 216, which corresponds with the ‘UID’ field value of 216, which is Arnold Schwarzenegger.
Understanding how the data is organized and what you want to visualize in the link chart will help you create the appropriate entity and relationship types. We’ll now walk through creating two entity types: one for movies and another for actors.
Movies
- Choose the ‘movies’ feature layer.
- Choose the field for your unique entities (what you want to see in your link chart).
- Name the entity type something meaningful to you, we chose ‘Movies’.
- Visually collapse duplicate entities because the “movie” field contains multiple entries per movie.

Actors
- Choose the ‘Actors’ feature layer.
- Choose the field for your unique entities (what you want to see in your link chart).
- Name the entity type something meaningful to you, we chose ‘Actors’.
- In the image below we chose to check the box to visually collapse duplicate entities; however, this field does not have duplicates so it will have no effect.

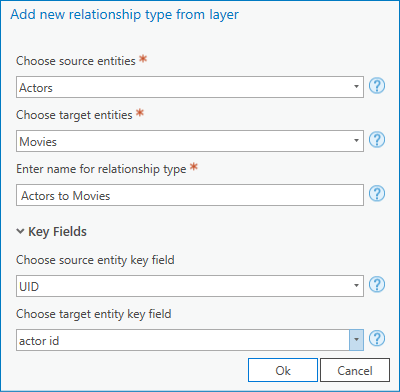
Once the entity types are created, we can now define how the entities are connected through relationship types. We want to visualize the cast of each movie, so we’ll define the relationship type as such:
- The ‘actors’ are the source entities.
- The ‘movies’ are the target entities.
- We named this relationship type, ‘Actors to Movies’.
- As discussed earlier, the feature layers associated with these entity types have a common key field for actors, the ‘UID’ field and the ‘actor id’. By setting key fields, links will be generated between the entities when the relationship type is created.
Notes:
- Entity types can be created in any order.
- If your feature layers do not have fields that contain “linking” values between entity types, you can skip setting the key fields. After the relationship type is created, you can manually draw links between entities using Add Link.
- If your feature layers have fields that contain “linking” values between entity types, but not all records have values, still set the key fields when you create the relationship type. As you update the data in the table the links will appear. You can also manually draw links between entities that don’t have a “linking” value by using Add Link.
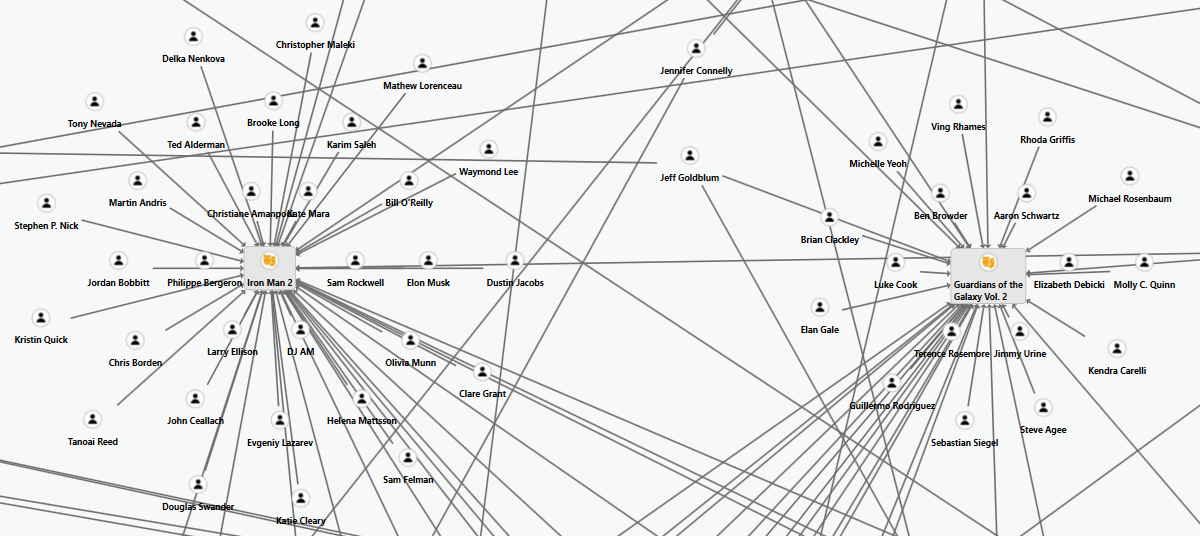
From the entity and relationship types created above, we now have a link chart that shows how actors are linked to movies.
Relevant Links
Perform analysis on your link chart


Thanks for sharing this, might I suggest posting the sample data as well? You can scrounge around and find similar datasets:
https://www.esri.com/training/catalog/5e964a018179a50b6abcc798/analyze-viral-community-spread-using-arcgis-insights/
https://learn.arcgis.com/en/projects/understand-the-refugee-crisis-with-link-analysis/
But it would be nice to keep everything same-same with your example.