With the release of Pro 2.1, you now have 3 powerful new clustering tools in the Spatial Statistics toolbox that will help you find patterns and make sense out of your data in new ways. What does a clustering algorithm do exactly? It finds natural subsets or groupings of features based on either location (spatial component only), values (attributes only) or a combination of both location and values. Clustering algorithms are a type of unsupervised machine learning, meaning you don’t have to define what it means to be a cluster up front (often referred to as training the model). Instead, the algorithm does that for you by evaluating the data and finding natural patterns that exist.
Finding Hidden Patterns in Point Data
Why?
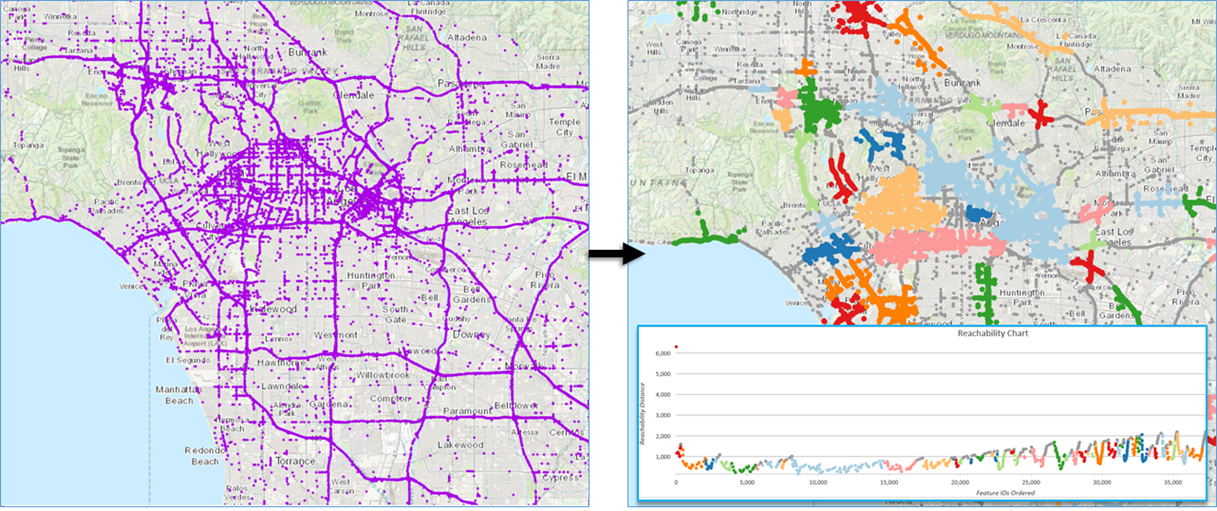
Visually looking for patterns in point data can quickly become difficult, especially as our datasets grow larger and larger. A year’s worth of crime occurrences or traffic incidents can number in the tens to hundreds of thousands with overlapping points hiding the actual patterns in our data. Using the Density-Based clustering tool can reveal patterns which are very difficult to see just by looking at the data points on the map.
What Data?
Density-based Clustering is used when you are looking for clusters in point data. An urban water utility with pipe rupture data could create clusters to locate problem prone areas. A coach with point data showing the location of goal scoring shots could determine the best position to shoot from. Earthquake data could be used to create clusters delineating fault zones. If your focus is on the spatial pattern in point data, density-based clustering methods could be just what you’re looking for.
How does it work?
The Density-based Clustering tool uses unsupervised machine learning algorithms to determine areas where point features are concentrated and where they are separated by empty or sparse areas. There are three algorithms powering the density-based clustering tool: 1) Defined Distance (DBScan), 2) Self-adjusting (HDBScan), and 3) Multi-scale (OPTICS). The algorithms all differ slightly under the hood and, depending on the analysis and your needs, offer varying levels of customizability. We suggest reading more about how they work and experimenting to see which method best fits your analysis. Depending on the method selected the tools also output powerful charts to help you understand the cluster members and how they were selected.
Leveraging Your Attribute Data with Multivariate Clustering
Why?
When your data contains more information than just location, the multivariate clustering tools let you unlock your attribute data. So much of the data we have access to has valuable attribute information, but even a handful of variables can be challenging to visualize and interpret patterns. The multivariate clustering tools let you feed variables into the algorithm to create clusters where the members have similar values. Depending on your data and analysis needs, you can choose the spatially constrained or non-spatial version of the tool. Optional constraint parameters can also be setup for the analysis, allowing you to create clusters of a certain size or with a value above or below a cutoff threshold. If this sounds familiar you may have used the Grouping Analysis tool – the new multivariate clustering tools build on and add new features to the Grouping Analysis methods.
What Data?
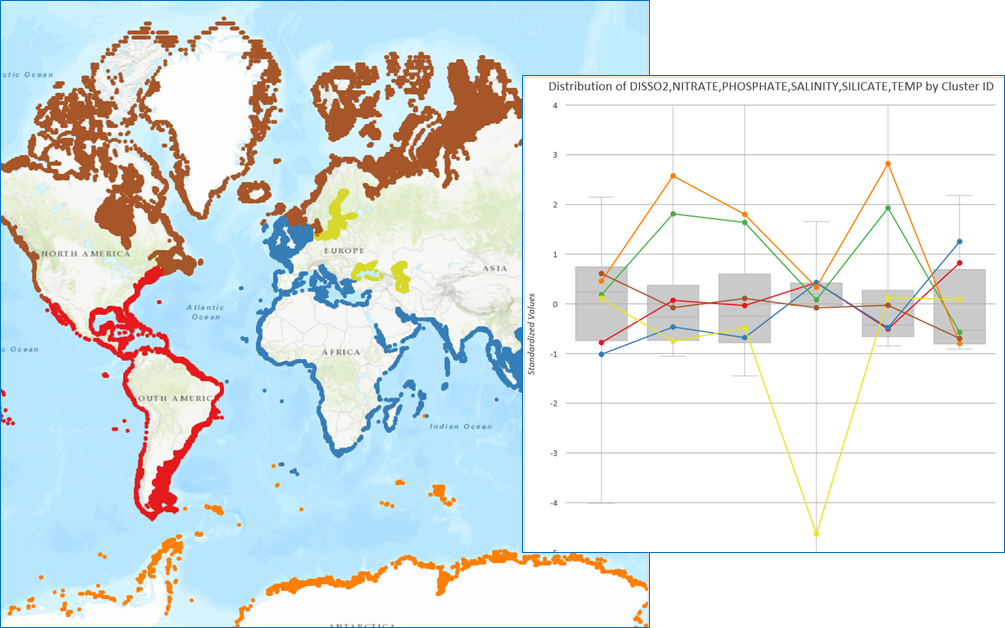
There are so many applications that multivariate clustering can be applied to, and it can work on both point and polygon data. Census data is a great candidate for multivariate clustering because there are so many attributes. In addition to clustering census data based on multiple attributes, you can also create clusters with a minimum population value or a maximum household income. Customer data combining buying patterns and demographic characteristics could help target your next sales campaign. Environmental data such as soil or water geochemistry samples could be used to find clusters of contamination or your next exploration target.
How does it work?
Spatially Constrained Multivariate Clustering is an implementation of the SKATER algorithm and works by growing and pruning a minimum spanning tree to create similar clusters. Learn more about the algorithms behind SKATER here. Multivariate Clustering is an implementation of the k-means++ algorithm and it partitions features so that within cluster differences are minimized.
These tools also take full advantage of Pro’s built in charting engine. After running either of the Multivariate Clustering tools, an interactive box plot is generated that helps you dig deeper into your results and better understand the characteristics of each cluster by exploring the distribution of the data and how each cluster fits in.
We hope that these powerful approachable machine learning techniques will help unlock the hidden patterns in your data. Keep an eye out for blogs and case studies highlighting these new tools in the coming months.
Article Discussion: