The R-ArcGIS Bridge (a.k.a. the R bridge) is the R integration project that enables a seamless connection between ArcGIS Pro, and the R ecosystem. The R-ArcGIS Bridge opens up scientific data analysis workflows and pipelines that can leverage the analytical capabilities of the ArcGIS platform and niche data science packages of R language in tandem.
Since its inception, the R-ArcGIS Bridge user base has grown to a whopping 36,000 downloads, as of writing this blog. In the past year, we have been receiving recurring questions that can be summarized with:
– Does it work with Living Atlas?
– We have massive amounts data in our ArcGIS portal, can we use it without downloading?
We announce new capabilities of the bridge that enable working with remote data sources, feature and image services, in addition to portal authentication functionalities that allow you to work with data that resides in a private portal. This blog summarizes some key new features and out-of-the-box features of arcgisbinding, R-ArcGIS Bridge’s R package, pertinent to working with remote data.
Below is a workflow for the new and updated functions of arcgisbinding to leverage remote data and in this blog we will explore ways in which you can utilize the R-ArcGIS Bridge to its full capacity to leverage new and improved functionality.

The Improved arc.open() Function
arc.open is the most frequently used function of the arcgisbinding package because it is the first function you need to retrieve any spatial data, vector or raster alike, whether it is in a local geodatabase or in a remote server. Inside R, this function creates an arc.dataset-class object that defines the spatial information and attribute information contained in the dataset. All you need for arc.open is the path to the spatial data that you would like to bring into R.
Assume you would like to bring in ACS population variables at the tract-level in as an R data frame.
All you need is to reference the URL for the feature service from arc.open and the function will make a call to this feature service and bring in the data definition. Here the URL for this feature service is https://services.arcgis.com/P3ePLMYs2RVChkJx/arcgis/rest/
services/ACS_Total_Population_Boundaries/FeatureServer/2.
You can bring this data in by simply calling arc.open on the URL. The code snippet above makes a call to the REST API and creates a definition of this dataset. Next, you can bring this feature service into R as a spatial data frame by simply calling arc.select on this data definition. This is the same function you would use for local data.
The new and improved arc.open allows you to interact with remote data sources with ease and opens up your R analysis to the wealth of spatial and space-time data maintained and curated by the ArcGIS community.
The ACS feature service is publicly available and getting this data into an R dataframe is a direct call to the feature service from arc.open. What if you have private, password-protected, feature and image services in a private portal? The next sections will elaborate how.
Accessing Protected Data in Private Portals
Not all data can be made publicly available due to the sensitivity of the data and/or privacy concerns pertaining to the data source. If you are working with such data and would like to have the seamless and effortless integration described above, this section is for you! Accessing data in your private portal is as easy as 1-2-3.
1. In ArcGIS Pro login to the portal that you need
2. Use arc.check_portal() to make sure the R-ArcGIS Bridge recognizes the sign in to the portal
3. Use arc.open on the feature service/image service URL to bring it into R
After these steps you can access your data that resides in your active portal. The process of reaching private remote data using the R-ArcGIS Bridge is summarized in the video below:
Private Data on Multiple Portals: Enter arc.portal_connect()
Lastly, you might be building an R script that consumes remote data from multiple portals. Note that only one portal can be active in ArcGIS Pro, at a time. We developed the new R-ArcGIS Bridge function arc.portal_connect() to connect to multiple portals.
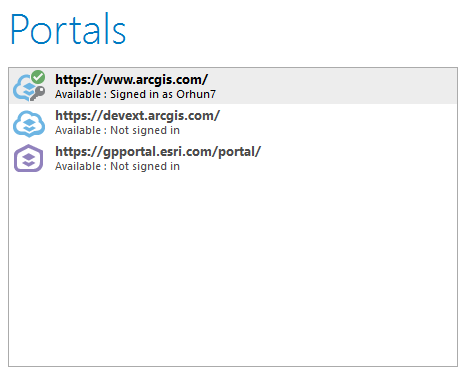
arc.portal_connect() can connect to any inactive portal added to the ArcGIS Pro instance. In the example above, devext is a portal that is inactive but is in the list of portals in ArcGIS Pro. If you needed data from this portal in addition to data from the active portal, you can sign on to it in your R instance simply with:
arc.portal_connect('https://devext.arcgis.com/', username, password)
In the code snippet above, you would need to replace the username and password with your credentials, and you would be on your way to consuming remote data from multiple portals.
Conclusion
The R-ArcGIS Bridge now works seamlessly with remote data sources whether they are public or reside in private portals. This development opens up your R and ArcGIS analysis to an ocean of curated, community-driven data. We are excited to see what you will do with this new functionality and are always excited to hear your needs of the R-ArcGIS Bridge.
Learn more about the R-ArcGIS Bridge on our product page and let us know of any feedback you may have on our GeoNet page.

Article Discussion: