Machine Learning (ML) refers to a set of data-driven algorithms and techniques that automate the prediction, classification, and clustering of data. Machine Learning is helping scientists understand past climates, better predict future climates and identify the large-scale weather patterns we experience daily. Modeling climate is a complex task where the circulation of Earth’s atmosphere and oceans is simulated under a variety of scenarios using mathematical models on supercomputers. These models produce vast quantities of output ripe for analysis using machine learning techniques. Using the output of a continental scale climate model, we recently did an analysis to find regions that have similar amounts of precipitation and similar temperatures (climate zones).
Why do we care about climate zones?
Your climate zone may have more of an impact on you than you know. Building codes that dictate how much insulation is required in the floor and walls of your home to meet the U.S. Department of Energy’s efficiency guidelines are based on a set eight climate zones. Epidemiologists have shown that climate zones can influence health outcomes and hospital admissions among the elderly. Of particular concern in this time of rapid climate change is that climate conditions influence your exposure to infectious diseases. On a more positive note, plant hardiness zones, a special type of climate zone, can tell you if you can grow your own avocados!
Why do we need to create alternate climate zones?
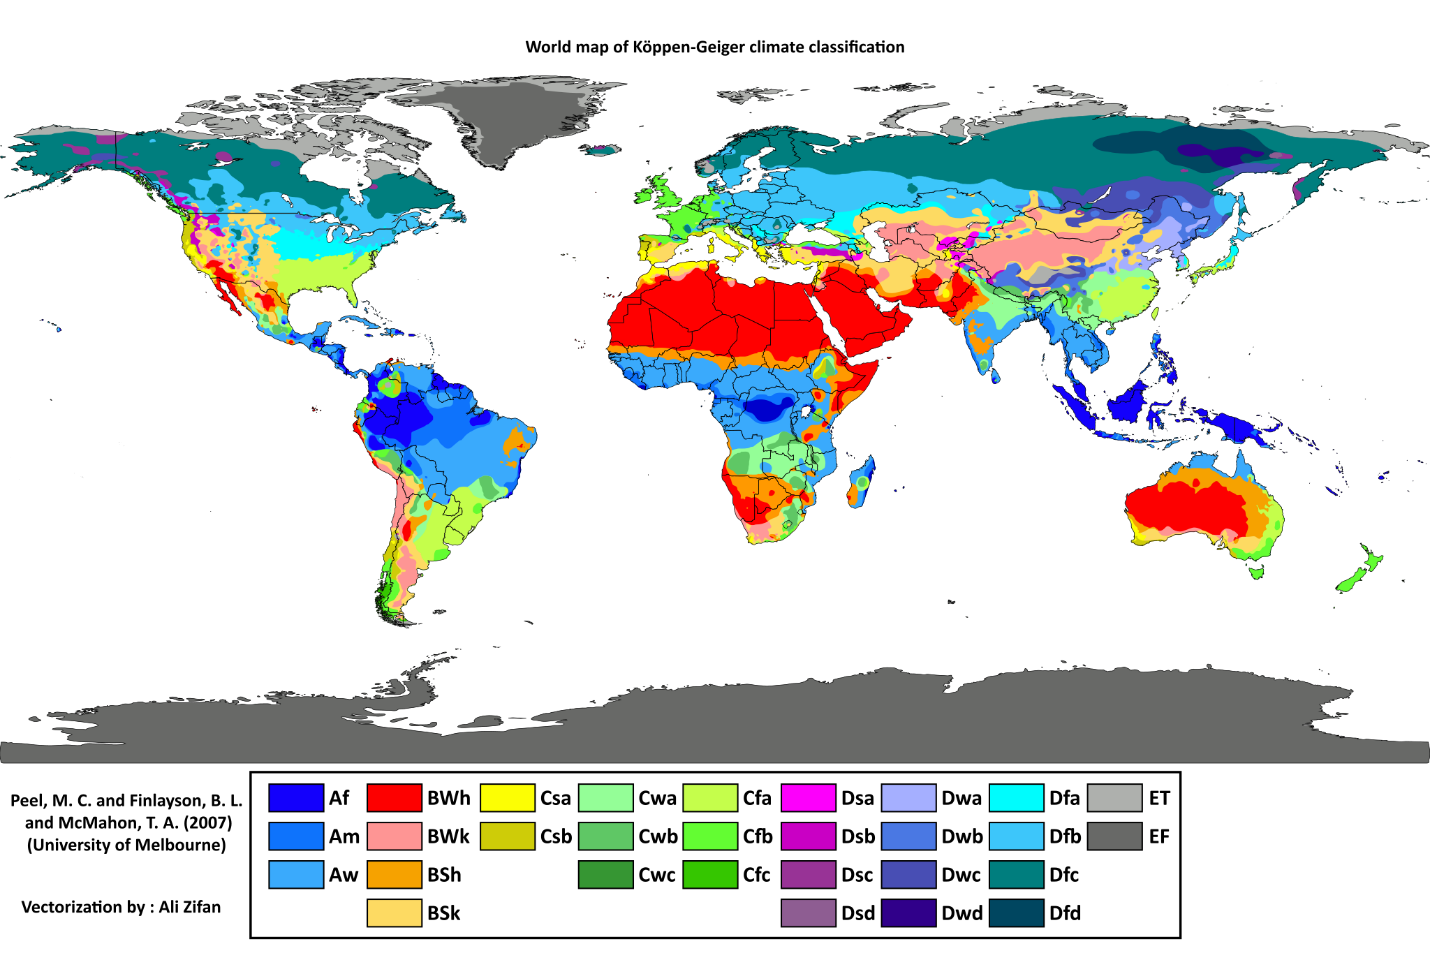
The Koppen climate classification was available as early as 1884 and divides the planet into five main groups. The Koppen classification was refined in the 1960s to produce the Trewartha climate classification. As their names imply, both systems are classifications of climate based on some prior rules. For example, in the Koppen system, any region where the average temperature in all 12 months was 64° F or above is classified as a tropical climate. Machine Learning would take a different approach. Rather than relying on some prior set of rules, it would allow the data to ‘speak for itself’ and divide into a natural classification. In machine learning terminology this is called unsupervised learning. This allows you to quickly create new, exploratory sets of climate zones. For example, the National Center for Atmospheric Research produces a climate model that projects temperature and precipitation in the year 2050 under a variety of scenarios that range from aggressive reductions in greenhouse gas emissions to business-as-usual scenarios where greenhouse gas emissions continue to increase throughout the 21st century. The data for these scenarios are available in the Living Atlas. Using machine learning, you could see how the projected changes in temperature impact the climate zones.
Creating alternate climate zones with traditional Machine Learning
Recall that climate zones are regions that have similar amounts of precipitation and similar temperatures. This sounds like a perfect task for clustering. The goal is to create regions where all the locations within each region are as similar as possible, and all the regions themselves are as different as possible. Since climate varies throughout the year, we wouldn’t want to use just the average temperature and precipitation at each location. We’ve used the long-term monthly means for precipitation and temperature for each of the twelve months as input to this analysis – 24 variables in all. Data for this blog are from NOAA’s North American Regional Reanalysis Model (NARR).
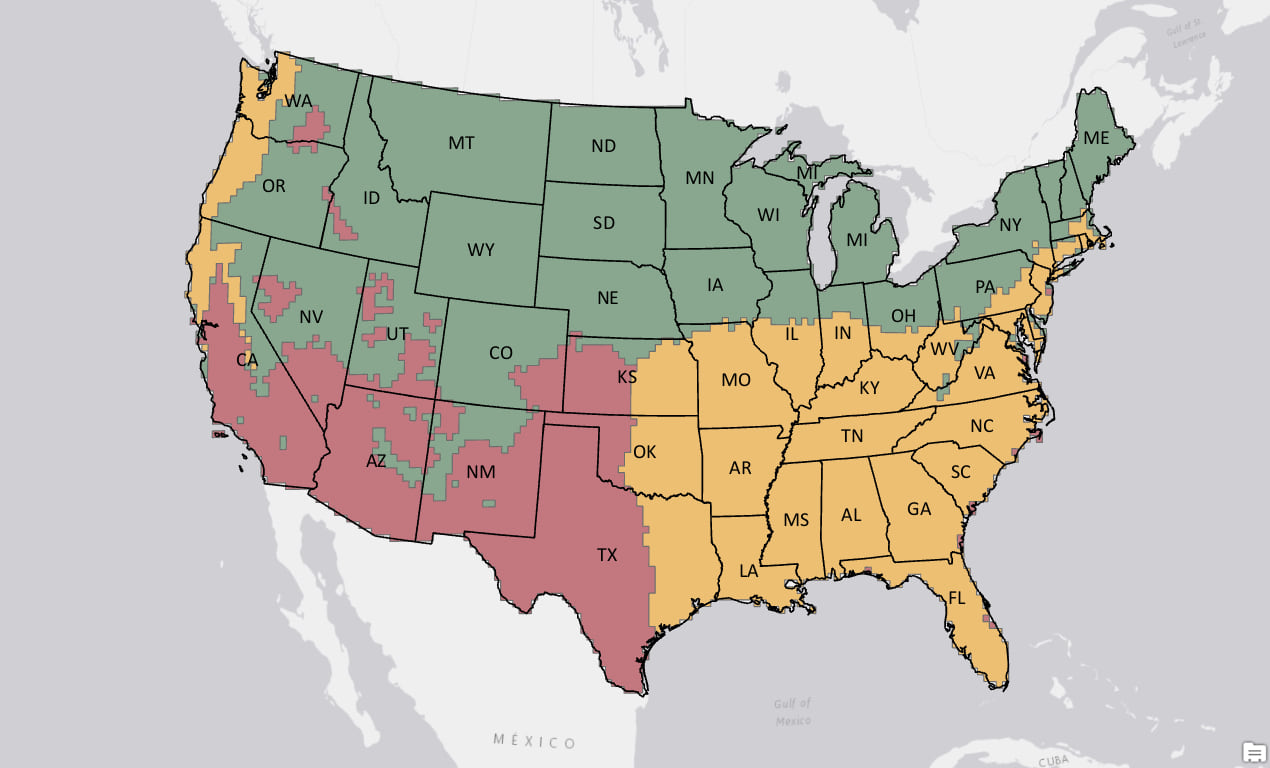
We used the Multivariate Clustering tool available in the Spatial Statistics toolbox in ArcGIS Pro to find natural clusters of features based solely on feature attributes. This tool uses a very common machine learning algorithm called k-means and found three ‘natural’ clusters in the data. While this clustering is not completely unreasonable, it is strange to see the Pacific Northwest and the Southeast in the same cluster. Also, there are patches of Southwest climate in Western Idaho. We can do better by providing the machine learning algorithm with more information – spatial information – something that is very important in climate.
Adding a spatial component
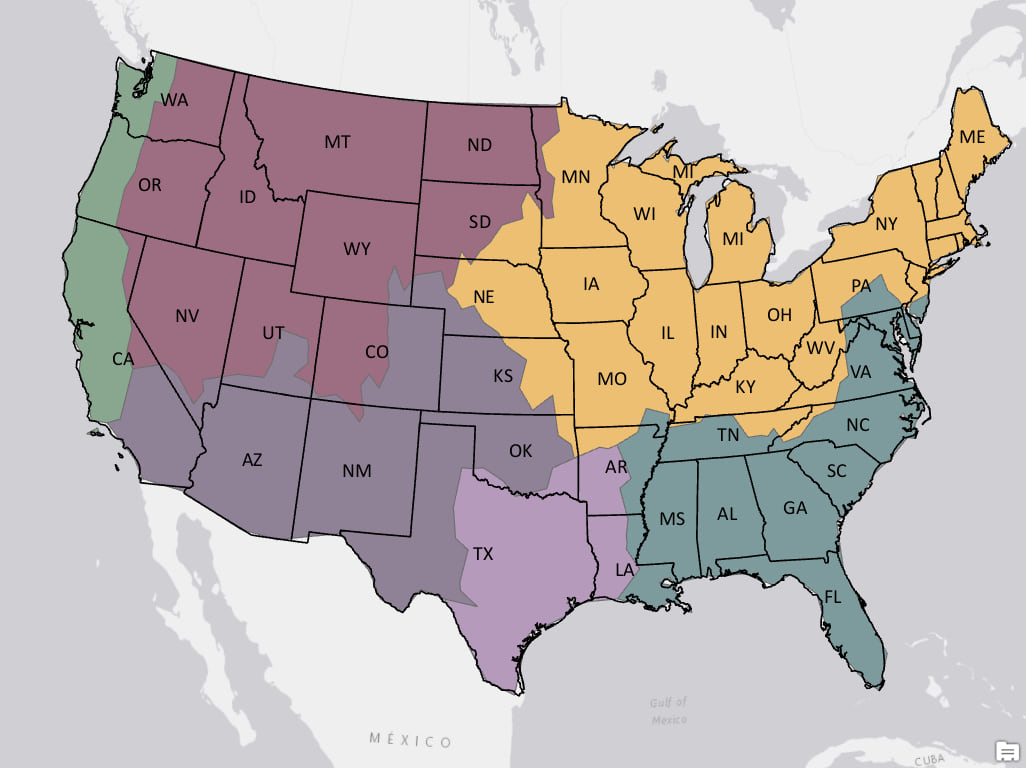
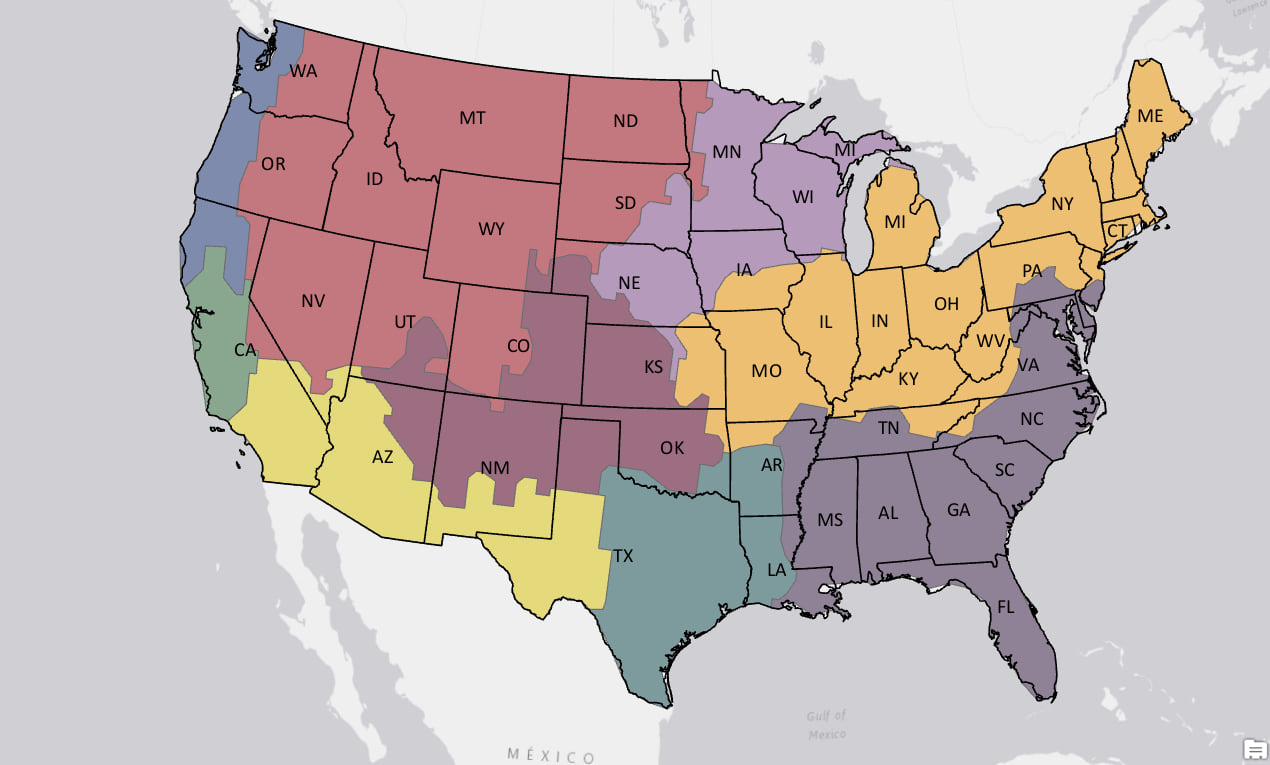
When we think of climate zones we often think about contiguous regions. We can still use the power of machine learning to build climate zones but we can force the algorithm to build contiguous regions by adding spatial constraints. We used the Spatially Constrained Multivariate Clustering tool in ArcGIS Pro to build an alternate set of climate zones. This tool is an implementation of the SKATER algorithm and works by growing and pruning a minimum spanning tree to create similar clusters. This time the tool found six natural clusters in the data and these seem more intuitive when compared to the non-spatial clustering. In fact, these six clusters separate warmer, drier Southern California from the more temperate and moist Northern California and Pacific Northwest. This alternate set of climate zones also separates semi-arid West Texas from the more humid eastern portion of the state.
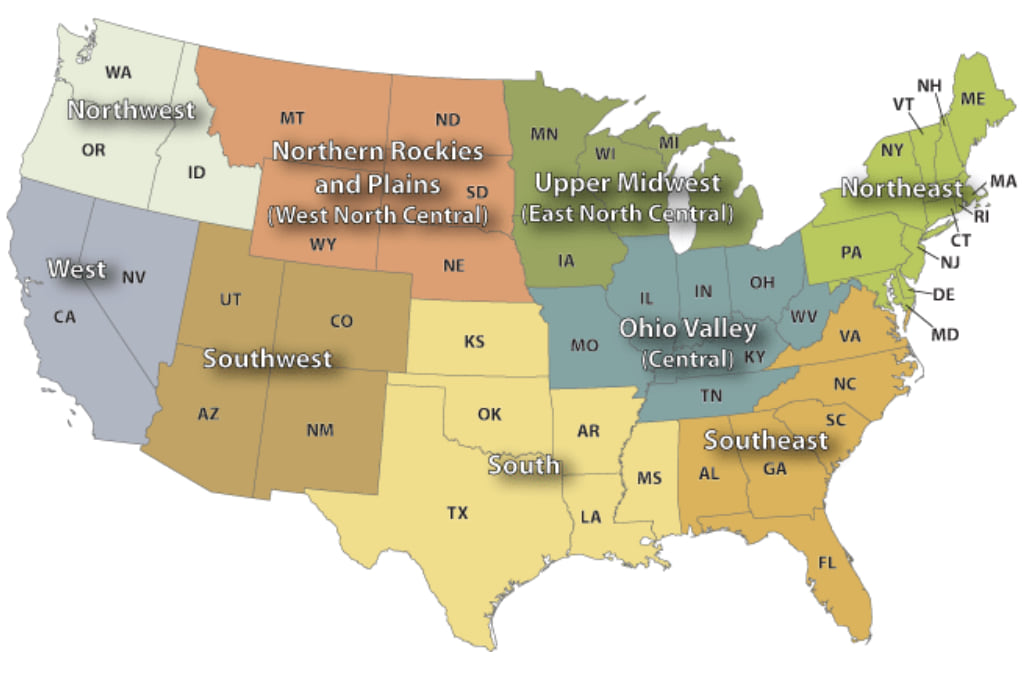
To compare our spatial machine learning climate zones to an existing set of climate zones, we reran the spatially constrained clustering asking for nine climate regions. This allows us to compare our climate regions to a set of nine climate regions developed by NOAA’s National Center for Environmental Information. Even though NOAA’s approach was to aggregate their data up to the state level, there are remarkable similarities between the two maps below.
The intersection of GIS, machine learning and climate science
This workflow illustrates the power of bringing together, GIS, spatial machine learning and valuable data from the climate sciences. The huge volumes of data coming from climate models and climate change research is overwhelming. You can use machine learning techniques to summarize and glean patterns from these vast amounts of data and turn them into understandable, actionable information products. We’re actively working to build the tools that help you build these information products, as well as pushing the limits of what it means to make machine learning truly spatial.
What are you going to do?
Here are three ideas for how you can explore machine learning and climate science in ArcGIS.
- Will climate zones change in the future? The National Center for Atmospheric Research produces a climate model that projects temperature and precipitation in the year 2050 under a variety of scenarios that range from aggressive reductions in greenhouse gas emissions to business-as-usual scenarios where greenhouse gas emissions continue to increase throughout the 21st century. The data for these scenarios are available in the Living Atlas.
- What would global climate zones look like? While the data used in this blog was from a regional model for North America, the NOAA’s Earth System Research Laboratory provides data for global climate models.
- Are temperature and precipitation sufficient to construct climate zones? This blog used only two variables, temperature and precipitation, to delineate climate zones. The NARR model contains other climate variables such as snow cover, cloud cover and wind.
NCEP Reanalysis data (NARR) provided by the NOAA/OAR/ESRL PSD, Boulder, Colorado, USA, from their Web site at https://www.esrl.noaa.gov/psd/
The blog post is provided by Kevin Butler. Kevin is a product engineer on the Spatial Statistics team. Comments about this blog, the data sources and workflows used are welcomed and can be submitted by leaving a reply on the blog. You must be logged in to post a comment.


Commenting is not enabled for this article.