I’m very excited to introduce you to this geoprocessing tool that was released with ArcGIS Pro 2.8 earlier this year. This tool allows you to perform some aggregated analysis from related records that was never even possible until ArcGIS Pro 1.4. But creating such layers was not a very user friendly task until 2.8 release. On top it required some expertise in SQL. Now with the advent of this tool anyone without any SQL knowledge can perform such analysis.
Before we start, please note that you must have your data in an enterprise database such as PostgreSQL, SQL Server, Oracle etc.
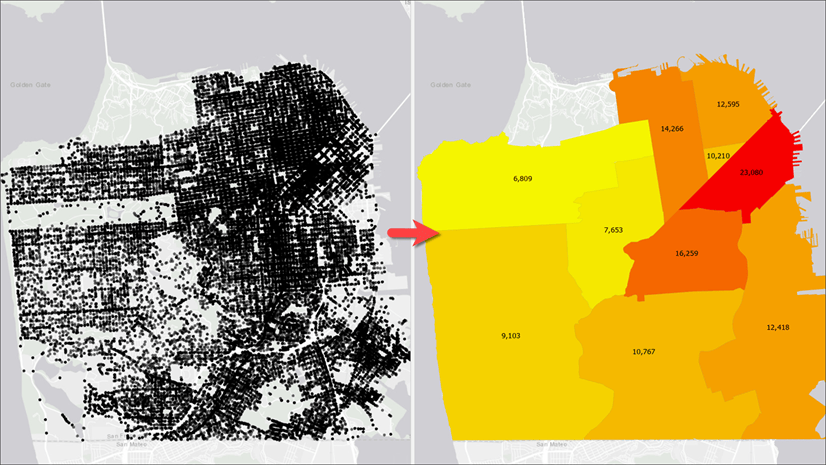
Let’s say you work at a federal agency. You have monthly unemployment data, recorded at county level, stored in a table. Let’s further assume this is a historic data set that spans over multiple years – meaning you have maximum 12 records for each county for each year. Now you need to make maps or perform some analysis using data aggregated at state level for the current month. As you have already figured out that there is a one-to-many relationship i.e. a state has >1 counties for multiple months.
Here are the steps (or something similar) that you’d most likely take:
- Select unemployment records for the current month using Select By Attributes geoprocessing tool
- Run Summary Statistics geoprocessing tool to compute total or/and average unemployment for each state using the state name/fips field as the Case field
- Join the output result to your state boundary layer
- Apply a new or predefined symbology to the layer with an attribute field that stores an aggregated results
Now, if you need to do the same for a different month or a different quarter or a fiscal year, you’d need to repeat the same steps. In this particular case, it might be okay to keep repeating, but in other cases such as property sales etc. where data comes in more frequently, keep repeating these steps might not be a good idea.
Instead wouldn’t it be more efficient if you could define such layer just once, and click a button to switch from one month to another month or quarter to produce map or data for that particular time window?
That is exactly what you can do with Make Aggregation Query Layer geoprocessing tool. You will find this tool inside Layers and Table Views toolset in the Data Management Tools toolbox in ArcGIS Pro.
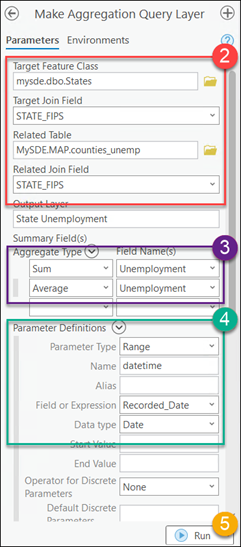
- Open the tool
- Fill in the top part with
- Target Feature Class and Related Table names, and
- Field names from both tables that will be used to join output aggregated results to features from the Target Feature Class
- In the Summary Field(s) section, define your desired aggregated statistics
- In Parameter Definitions section, define a Range parameter using a date/time field
- Make sure in the following sections the auto picked objectid field, shape type or coordinate system are correct. Click Run
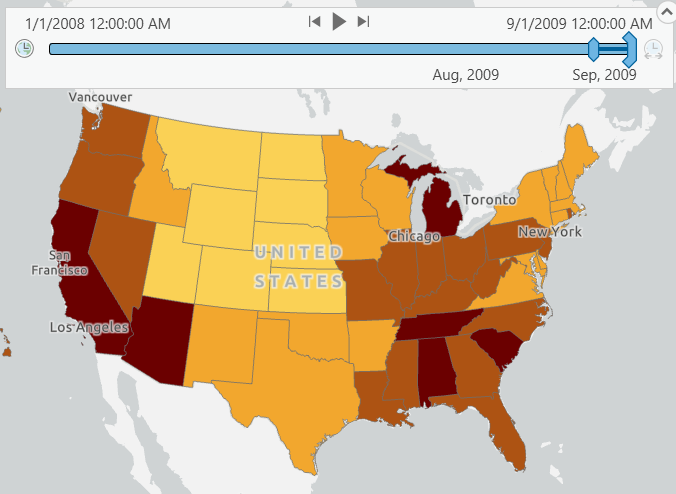
What you get at the end of a successful run is a time enabled query layer. Use the time slider to pick any time window to produce a map using dynamically computed summary statistics for the given time window.
If needed, you can choose Data | Export Features command from the layer’s context menu to persist this result. Or you can use this layer directly to any other geoprocessing tool for further analysis.
Please see related blog posts below for a few other use cases where you will find this tool very helpful, and to learn more about the concept and the technical details on this approach.
Finally, here is the link to the tool’s help: https://pro.arcgis.com/en/pro-app/latest/tool-reference/data-management/make-aggregation-query-layer.htm.

Article Discussion: