When you have an analysis to do, it may not be too difficult to find a suitable boundary feature layer that can serve as a starting point. But how often does it have all the attributes you need, or match the applicable geographic extent? Not frequently. In this blog post, we will look at a process for editing a boundary feature layer and enriching it with data.
In this scenario, you need demographic data for a territory design analysis. You need a dataset that tells you how the high schools and high-school age population are distributed across Marion County, Indiana. You can read about the territory design analysis in the Learn ArcGIS Lesson Balance Territories for College Recruiters. The other dataset needed for this analysis is the public high schools. Another blog post described the cleanup process for that layer.
While the college recruitment scenario is specific, the data preparation techniques covered in this blog post are common to many GIS projects. In this workflow, you will find a USA Block Group layer and limit its extent to Marion County. You’ll use the Spatial Join tool to find the number of high schools in each block group, and the Enrich tool to find the number of high-school age students.
You can download the project package with the data to be used. Double click the file to open it in ArcGIS Pro. The prepared public schools dataset and the polygon boundary for Marion County will be listed in the Contents panel on the left. (Data sources: High school locations derived from: Public Schools, Oak Ridge National Laboratory (ORNL), National Geospatial-Intelligence Agency (NGA) Homeland Security Infrastructure Program (HSIP) Team; County boundary: City of Indianapolis/Marion County, IN, via OpenIndy Data Portal).
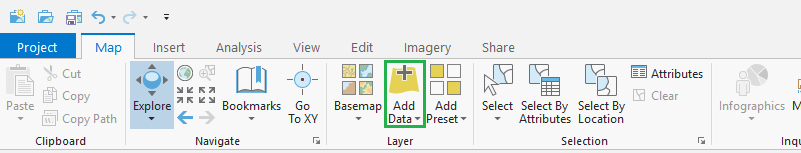
Next, you will search Esri’s Living Atlas for a suitable Block Group layer. Click Add Data again.
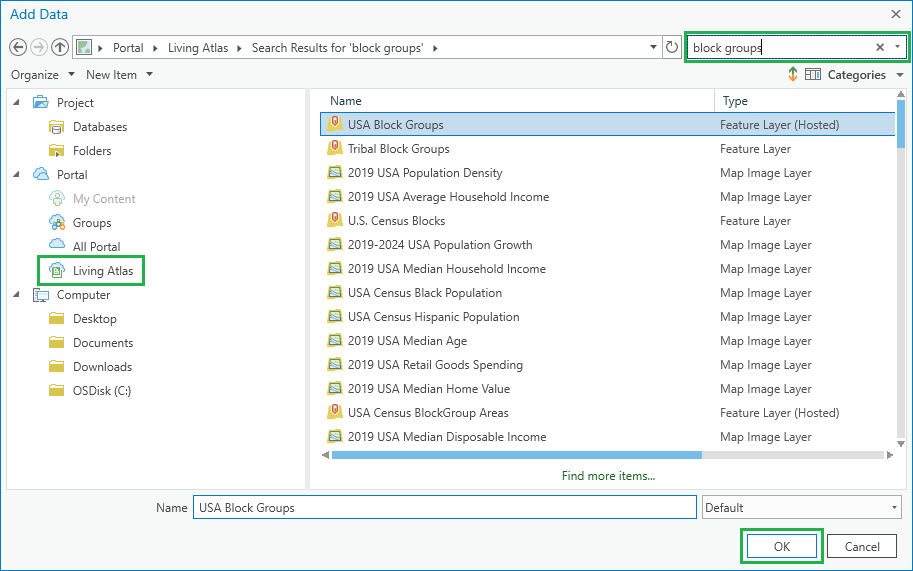
In the Add Data dialog, on the left select Portal > Living Atlas. Type ‘block groups’ in the search bar at the top right and press Enter. In the search results, select USA Block Groups. Click Ok.
The USA Block Groups feature layer will be added to your project and appear in the Contents panel on the left.
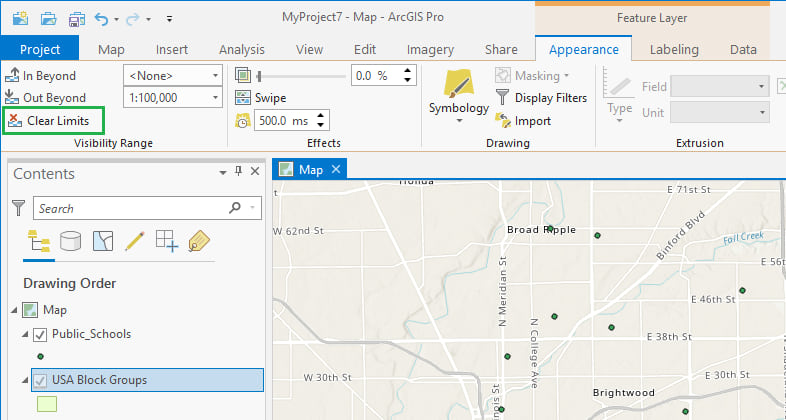
Tip: If it is not visible on the map it is probably because there is a Visibility Range applied to the layer. Select the layer, click the Appearance tab on the ribbon, and click the Clear Limits button so that it is visible at that zoom level.
Let’s take a look at what fields are available for this layer.
Right-click the USA Block Groups layer, point to Design, and choose Fields.

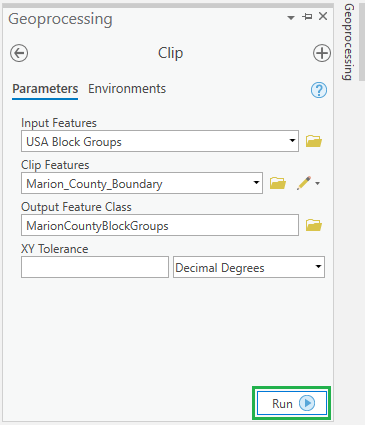
You will now clip the Block Groups to Marion County.
Open the Clip Geoprocessing tool. Select USA Block Groups in the Input Features drop-down menu, and Marion_County_Boundary in the Clip Features drop-down menu. Type MarionCountyBlockGroups in the Output Feature Class field – this will be the name of the new clipped feature layer.
The new feature layer MarionCountyBlockGroups is created and listed in the Contents panel . You can remove or turn off the USA Block Groups layer.
For your territory design analysis, you need the block group layer to include an attribute for high school count, which would be the number of high schools in each block group. To accomplish that, you will perform a join operation of the polygon block group layer with the points high schools layer.
Open the Spatial Join Geoprocessing tool. In the Target Features dropdown, select MarionCountyBlockGroups, and in the Join Features drop-down, select Public_Schools. In the Output Feature Class field, type MarionCountyBlockGroups_Join. Click Run.
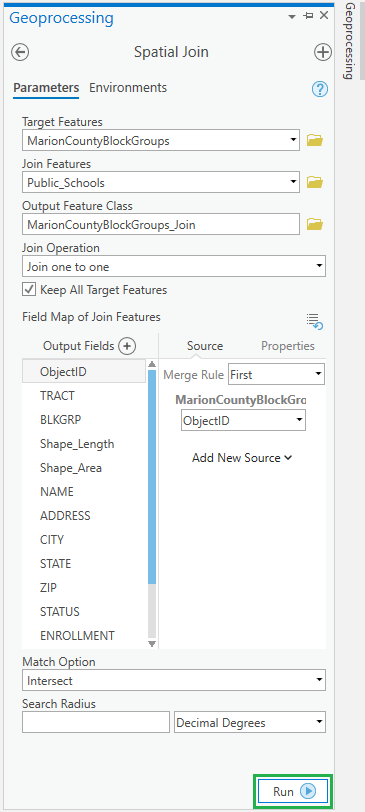
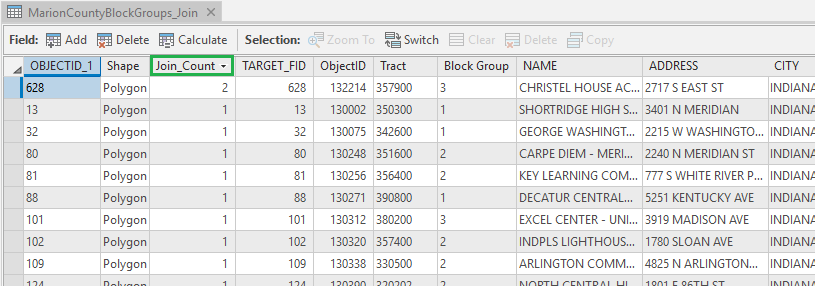
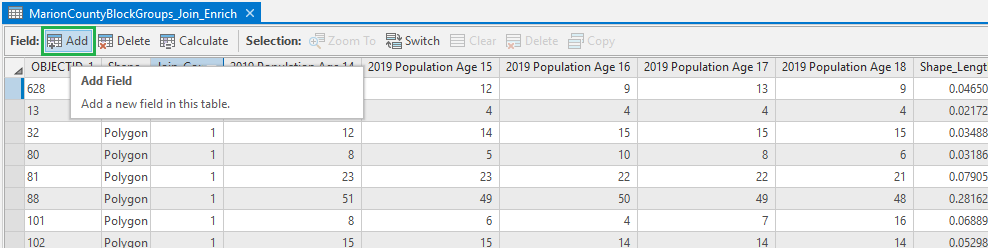
The new feature class is created and listed in the Contents panel. If you open its attribute table, it has a record for every block group, and a join count attribute that is the number of high schools in that block group.
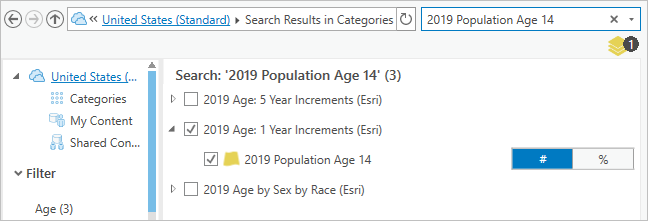
Next, you will use the Enrich Geoprocessing tool to add separate attributes for Age 14, 15, 16, 17 and 18 population to the new layer.
Open the Enrich Geoprocessing tool. For Input Features, choose the new joined block groups layer. Click Variables to bring up the Add Variables dialog.
Search for and add the following variables:
- 2019 Population Age 14
- 2019 Population Age 15
- 2019 Population Age 16
- 2019 Population Age 17
- 2019 Population Age 18
Click Run.
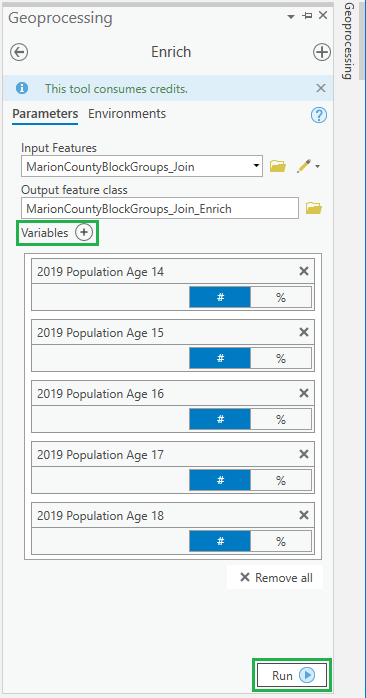
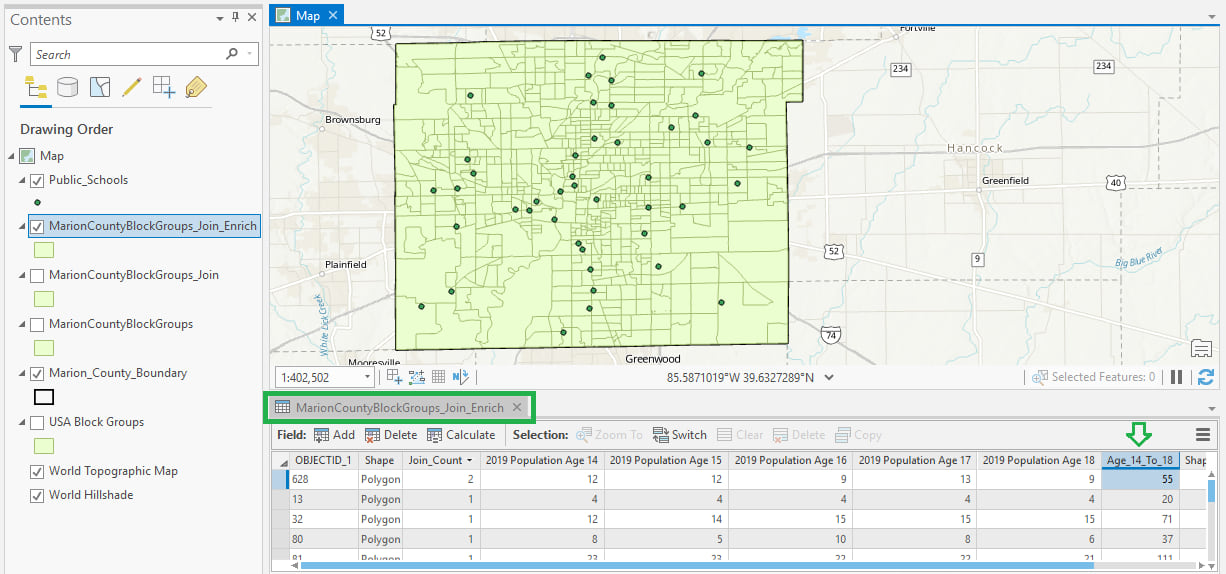
The feature class MarionCountyBlockGroups_Join_Enrich is created. Right click on it in the Contents panel and open the attribute table. It has separate attributes for each of the Age 14 through 18 year populations. You will add a new field for the total Age 14 through 18 population and calculate the values for it. Click Add in the top left of the attribute table.
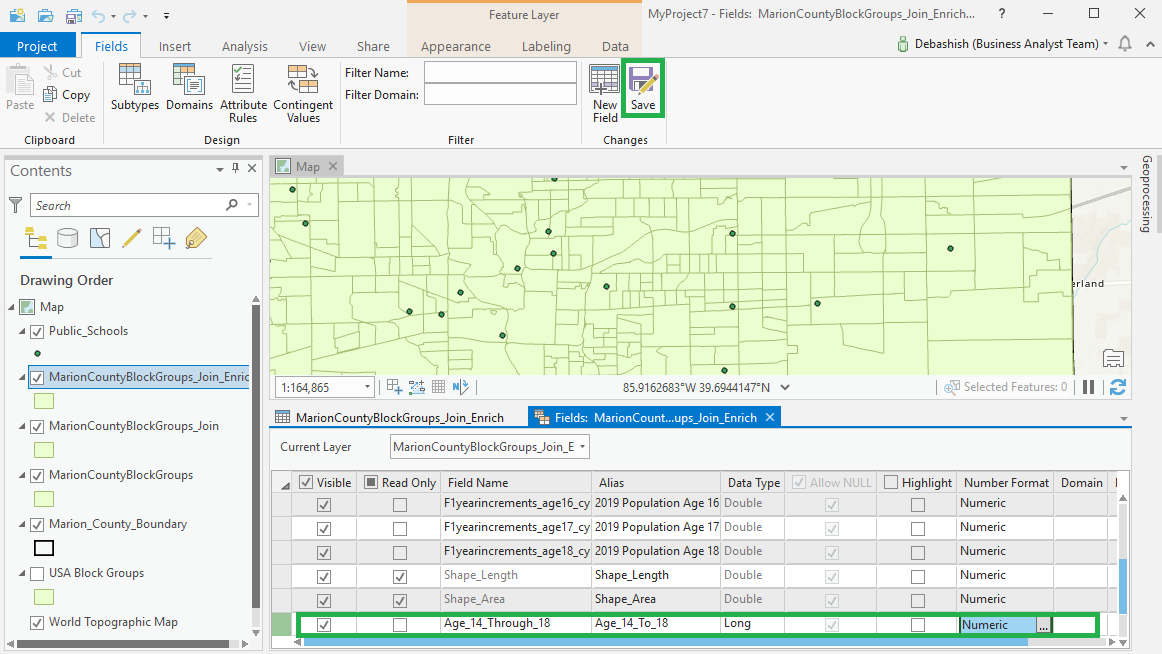
The new variable will be added at the bottom of the Fields table. Type in a Field Name, Alias, and select a Data Type and Number Format. Click Save in the ribbon at the top to add this field to the attribute table.
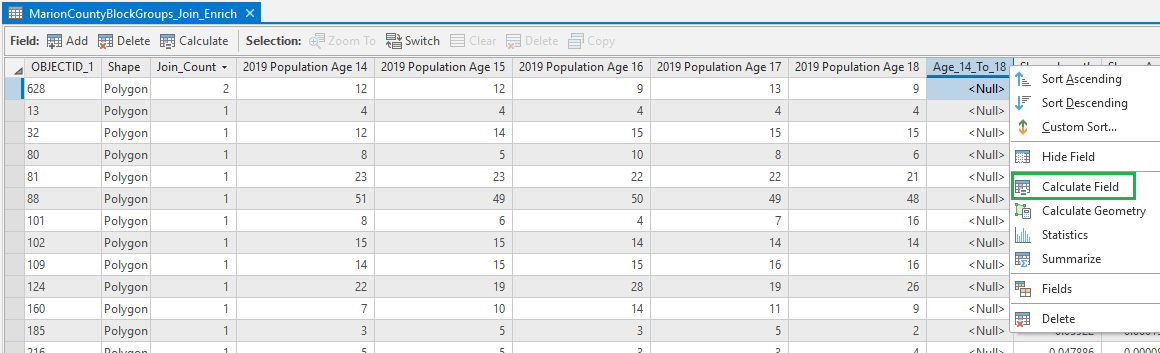
In the attribute table, the newly attribute appears but the values are null, as they haven’t been specified. Right click on the column header and click Calculate Field.
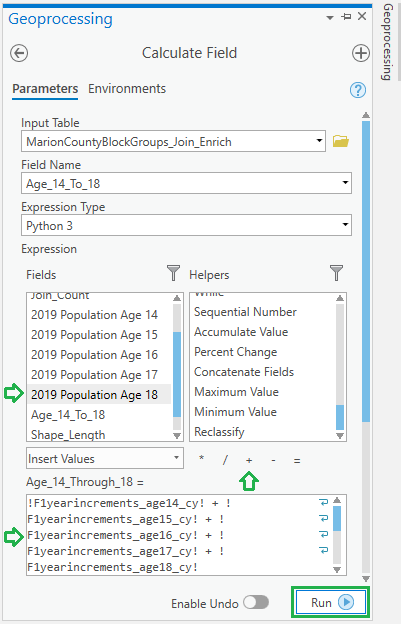
The Calculate Field Geoprocessing tool opens. You can double click on a variable under Fields to add it to the Age_14_Through_18 = text box and use the + operator before adding the next variable. Repeat for each necessary variable to formulate an expression that is the sum of all the individual year age variables. Click Run.
The Age_14_To_18 values are now populated in the attribute table, and the block groups layer is now ready to be used in your analysis.
To simplify the name, you could consider removing the initial layer you started with and renaming this layer to MarionCountyBlockGroups.
In this blog post, we went over the process to limit the geographic extent of a boundary feature layer and enrich it with data, to create a layer ready to use in an analysis. You don’t always find feature layers that conform exactly to the needs of your analysis but using spatial processing tools and data enrichment, you can transform a layer into a form that is suitable.

Commenting is not enabled for this article.