There are many tools available in ArcGIS Pro for analyzing point samples – spatial regression, interpolation, and hot spot analysis, just to name a few. But all of these tools assume that you already have point data, and they further assume that the samples are representative of the study area that you are investigating. But what if you don’t have data and need to decide which locations to take samples before performing your final analysis? In principle, you can sample data anywhere in the study area, but data collection can be very costly, so it’s important to create a spatial sampling design tailored to the goals of your study. This is where the Create Spatial Sampling Locations tool comes in.
The tool allows you to create sampling locations within polygon or categorical raster study areas and offers various sampling designs, including simple random sampling, stratified random sampling, systematic sampling, and cluster sampling.
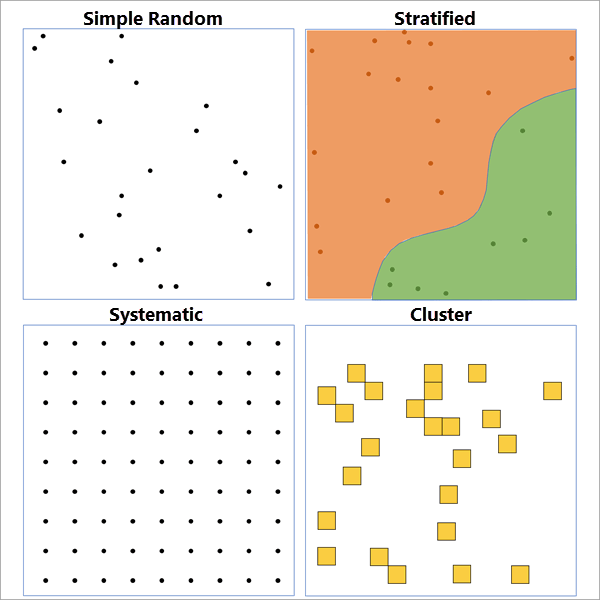
- Simple Random Sampling – Points are created randomly and independently within the study area, giving no preference to any particular location. This sampling design is most useful for holistic and unbiased assessment of the study area. You only need to define the study area and say how many points you want to create.
- Stratified Random Sampling – The study area is divided into distinct strata, and points are created randomly within each stratum. This sampling design ensures that all strata are properly represented in the sample. This is useful when the study area has distinct regions that are each of research interest, such as soil classes, administrative districts, or climate zones. When stratifying, you can define the strata in several ways: each individual polygon (or contiguous raster region) can be a stratum, or you can use a strata ID field to define the strata. You also need to define how many points to create in each stratum. You can create an equal number of points in each stratum, have the count proportional to the area of the strata, or have the count equal to or proportional to a population field.
- Systematic Sampling – Points are created in a nonrandom pattern throughout the study area according to various tessellations, including hexagonal, square, or triangular grids. This sampling design ensures complete coverage of the study area so that no areas are over- or under-sampled by chance.
- Cluster Sampling – Random polygons are created throughout the study area by creating a background tessellation and then randomly selecting some of the polygons from the tessellation. This is useful when you want to perform a deep, exhaustive study of small areas, for example, selecting areas of a forest and then creating an inventory of all tree species within each of the clusters.
Example 1 – Forest stand polygons
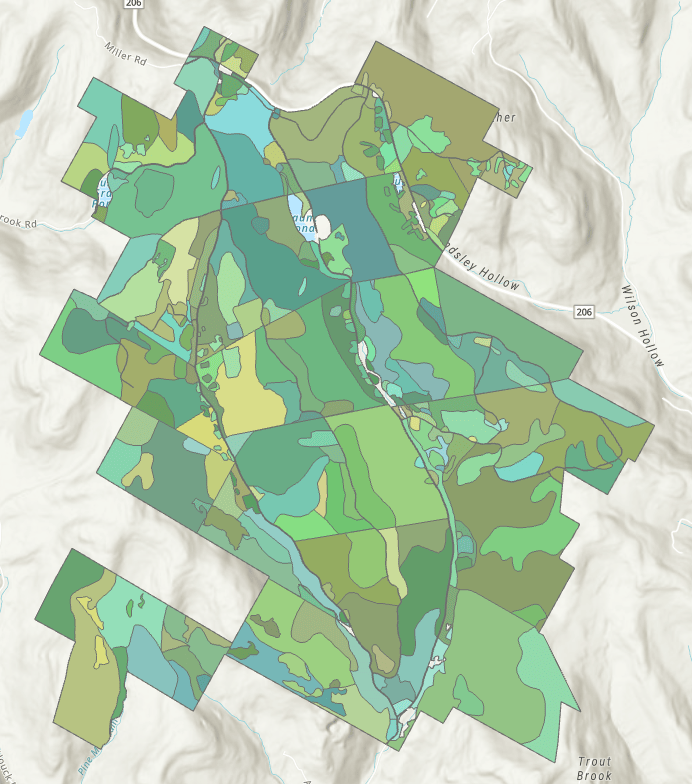
For the first example, we’ll use forest stand polygons in New York. There are 249 forest stands in this study area, and spatial sampling can be used to sample the various tree species and investigate the overall forest health.
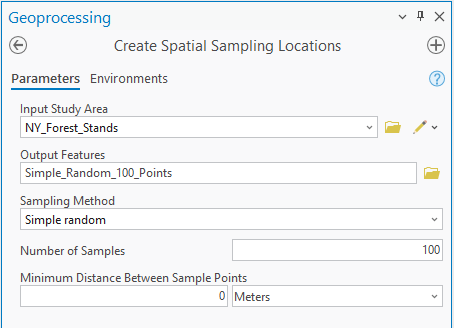
First, we’ll perform a simple random sample and create 100 points randomly throughout the forest, ignoring the borders of the individual forest stands. In the tool, after providing the forest stand layer and specifying an output name, choose Simple random in the Sampling Method parameter and specify 100 for the Number of Samples parameter.
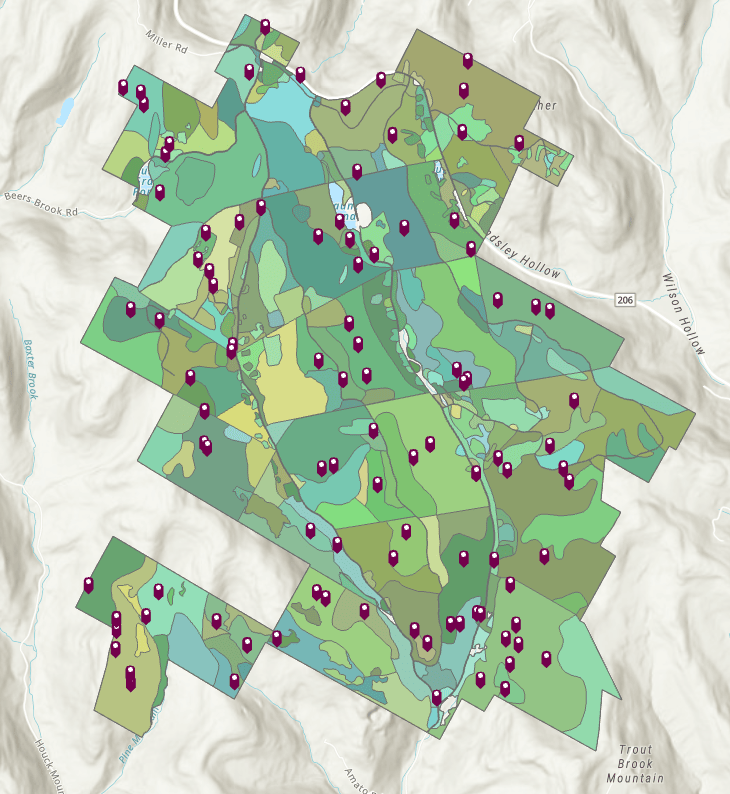
Running the tool creates 100 points randomly throughout the study area, and these are the suggested locations to sample trees or soil.
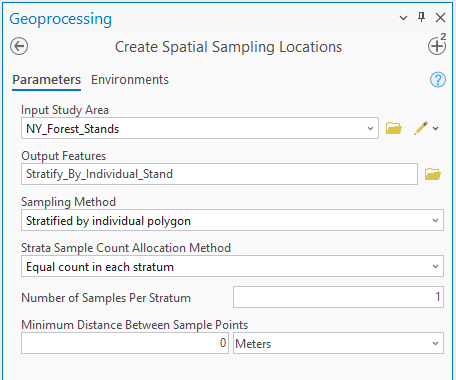
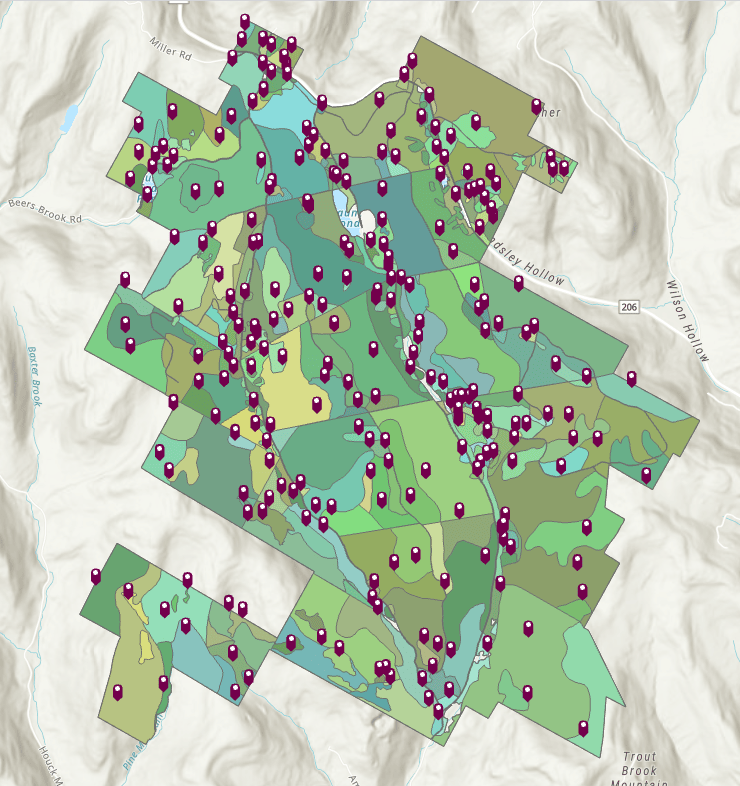
Next, we’ll stratify by the individual forest stand polygons and create one point within each forest stand. To achieve this, choose Stratify by individual polygon for the sampling method, choose Equal count in each stratum for the Strata Sample Count Allocation Method parameter, and specify 1 for the Number of Samples Per Stratum parameter.
This produces exactly one point randomly within each of the 249 forest stands. Notice that the points are more clustered in areas with smaller forest stands.
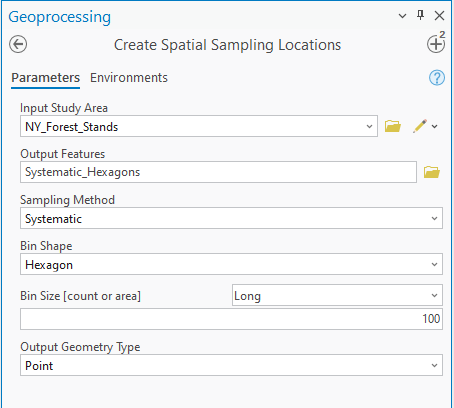
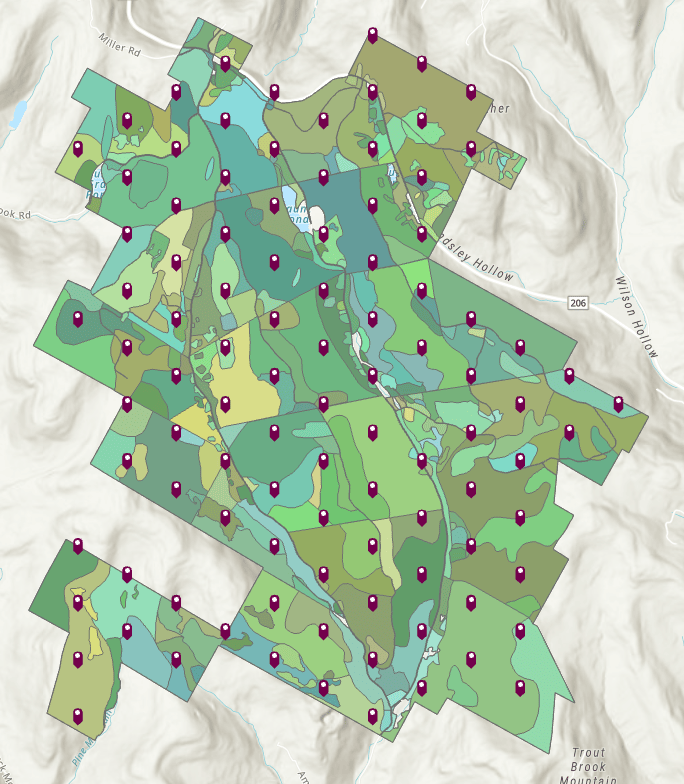
Next, we’ll create a systematic sample of 100 points in a hexagonal tessellation. After choosing Systematic for the sampling method, choose Hexagon for the Bin Shape parameter, and choose 100 for the Bin Size parameter. Note that you can provide the bin size as either a number (the count of total points) or provide the area of each tessellation. Prior to this tool, there was no way to create a specific number of tessellated features within an area without trial and error to determine the correct separation distance between the points (this is harder than it sounds).
This produces exactly 100 points in the forest in a hexagonal tessellation. This sampling plan ensures complete coverage of the forest with no areas over- or under-represented in the sample.
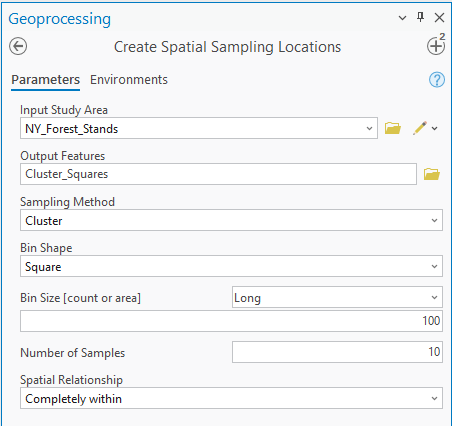
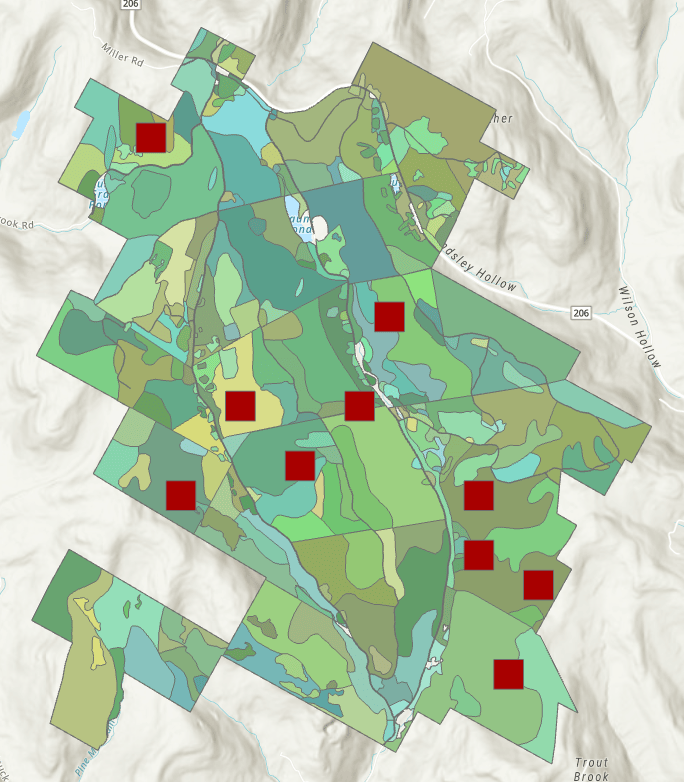
Finally, we’ll create a cluster sample by creating 100 tessellated squares in the study area, then randomly select 10 of them as the clusters. The parameters are nearly the same as systematic sampling, but you must specify the 10 for the Number of Samples parameter. Additionally, we’ll choose to only include cluster polygons that are completely within the study area using the Spatial Relationship parameter.
This produces 10 random squares within the study area, and each of these areas can be exhaustively studied to determine the ecological characteristics of small sections of the forest.
Example 2 – World Terrestrial Ecosystems raster
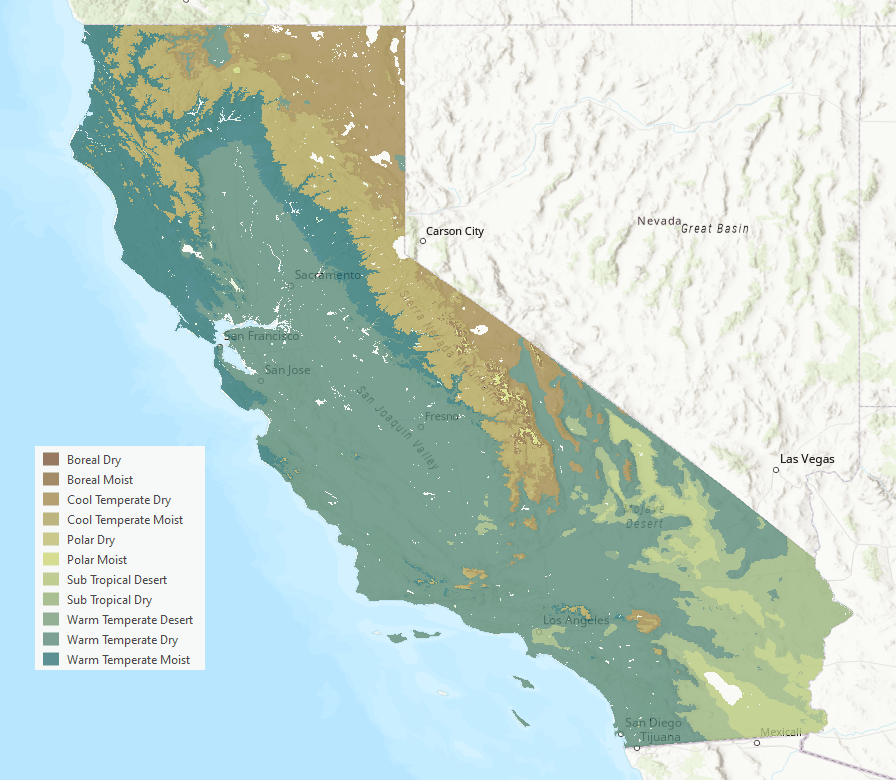
In the first example, you learned how to use the tool with a study area composed of polygons, but you can also define the study area using a categorical raster. In this example, we’ll use the World Terrestrial Ecosystems raster to sample temperature-moisture classes within California. There are 11 temperature-moisture classes within the state, such as Cool Temperate Moist and Sub Tropical Dry.
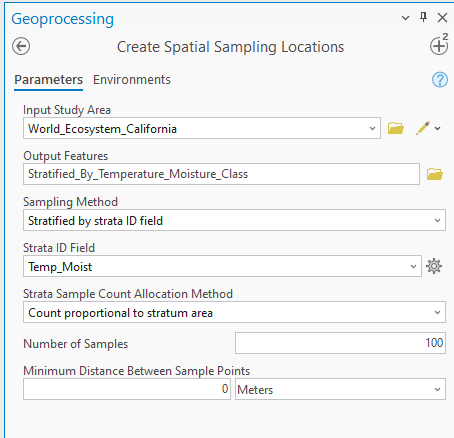
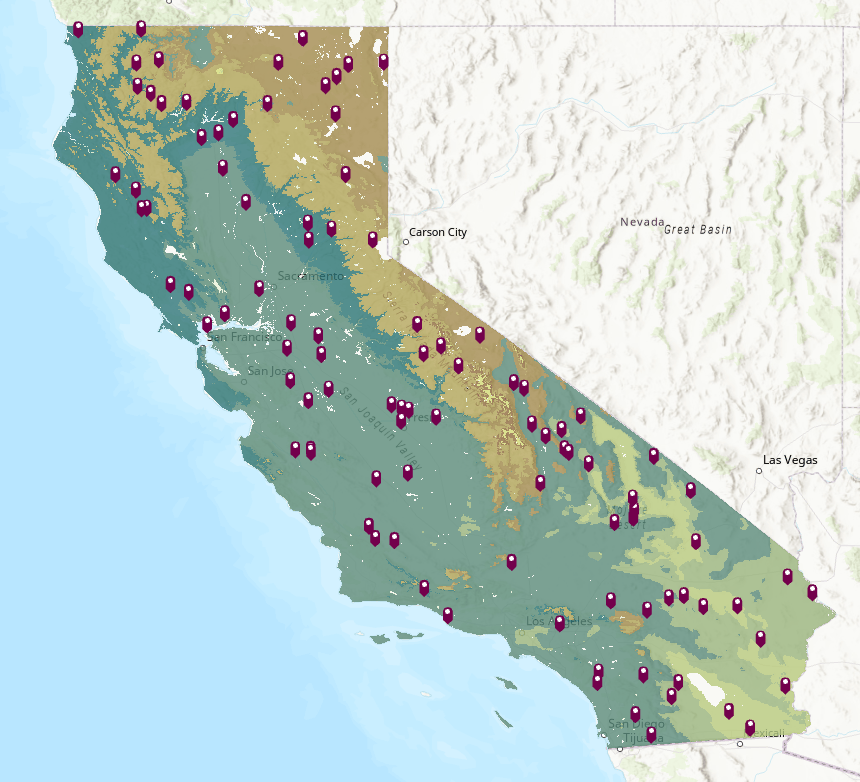
First, we’ll stratify by the temperature-moisture class and create 100 total points. However, rather than create an equal number of points in each class as in the previous example, we will allocate the 100 points proportionally to the area of each class, since some of the classes are much larger than others. Choose Stratify by strata ID field for the sampling method, provide the field of temperature-moisture class in the Strata ID Field parameter, choose Count proportional to stratum area for the allocation method, and specify 100 for the number of samples.
This produces 100 points across California and looks similar to a simple random sample, but each temperature-moisture class contains at least one sample, and the sample count of each class is proportional to its total area.
Finally, we’ll create a more advanced sampling design by creating two different sampling plans and merging the resulting points together into a single dataset (called a composite or mixture sampling design). Composite sampling is useful because each sampling design has advantages and disadvantages, so different sampling designs can be combined to mitigate the downsides of individual sampling plans.
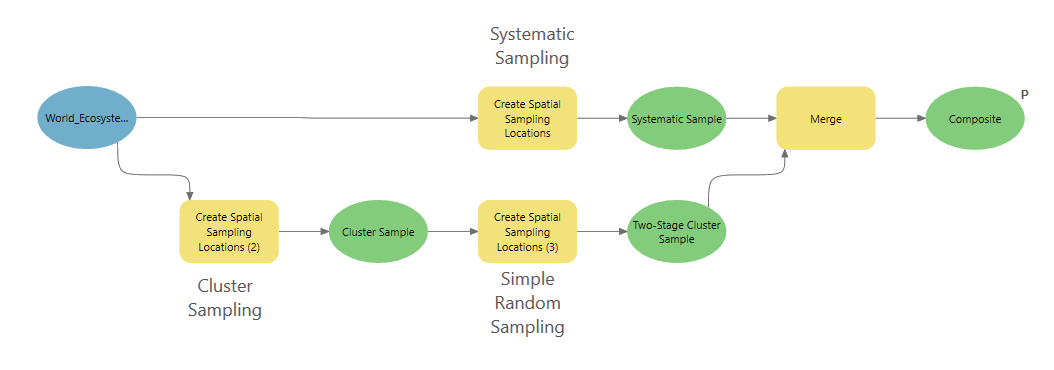
For this example, the first component of the mixture will be a systematic sample of 100 points in a hexagonal tessellation. The second component will be a two-stage cluster sample, where you first create cluster polygons, then randomly create points within the cluster polygons.
The top row in the model below is the systematic sample, and the bottom row is the two-stage cluster sample. To create the two-stage cluster sample, you first create a cluster sample and then use simple random sampling to create 100 points within the cluster polygons. At the end of the model, the two sampling designs are merged together.
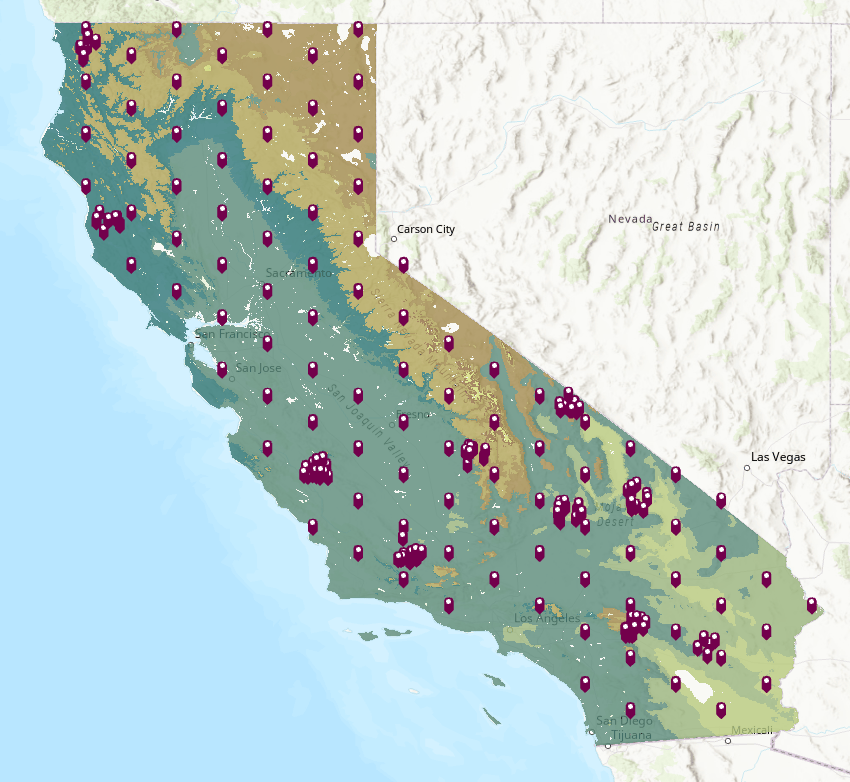
This produces 200 total sample locations, where 100 are in a hexagonal tessellation, and the other 100 are clustered together in small patches. This allows you to attain complete coverage of the study area (systematic sampling) but also create clusters of points that are close together (two-stage cluster sampling) to investigate how the samples interact at short distances.
Conclusion
The new Create Spatial Sample Locations tool provides a discoverable and flexible set of capabilities for performing the crucial first step of many analytical workflows. With various sampling designs and convenient methods for allocating samples to strata, this tool will be useful for various fields that employ spatial sampling, including forestry, ecology, climatology, and marine ecosystem research. We hope you’ll try it out and make use of it in your sampling workflows.
Data References
The forest stand polygons are a small subset of the State Land Forest Stands layer provided by New York State Department of Environmental Conservation. See the documentation for the data.
The World Terrestrial Ecosystems raster is an extraction within California of the following data:
https://www.sciencebase.gov/catalog/item/6296791ed34ec53d276bb293
Roger Sayre, Deniz Karagulle, Charlie Frye, Timothy Boucher, Nicholas H. Wolff, Sean Breyer, Dawn Wright, Madeline Martin, Kevin Butler, Keith Van Graafeiland, Jerry Touval, Leonardo Sotomayor, Jennifer McGowan, Edward T. Game, Hugh Possingham, An assessment of the representation of ecosystems in global protected areas using new maps of World Climate Regions and World Ecosystems, Global Ecology and Conservation, Volume 21, 2020, e00860, ISSN 2351-9894, https://doi.org/10.1016/j.gecco.2019.e00860.


Article Discussion: