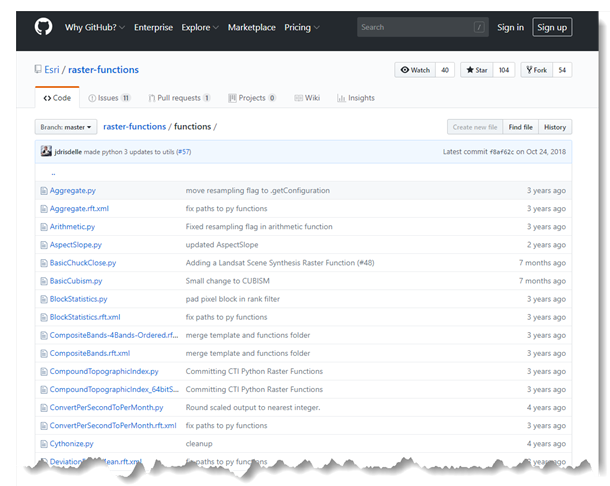
Did you know there is a huge repository of powerful Python Raster Functions that you can use for raster analysis and visualization? On the Esri/raster-functions repository on GitHub, you can browse, download, and utilize customized raster functions for on-the-fly processing on your desktop or in the cloud.

What are Python raster functions, you ask?
A raster function is a sneaky way to perform complex raster analysis and visualization without taking up more space on your disk or more time in your day, with on-the-fly processing. A single raster function performs an analysis on an input raster, then displays the result on your screen. No new dataset is created, and pixels get processed as you pan and zoom around the image. You can connect multiple raster functions in a raster function chain and you can turn it into a raster function template by setting parameters as variables.
A Python raster function is simply a custom raster function. A lot of raster functions come with ArcGIS out-of-the-box, but if you don’t find what you’re looking for or you want to create something specific to your needs, you can script your own with Python.
There are a lot of Python raster functions already written and posted for everyone to use, and they’re easy to download and use in ArcGIS. And some of them are unbelievably cool.
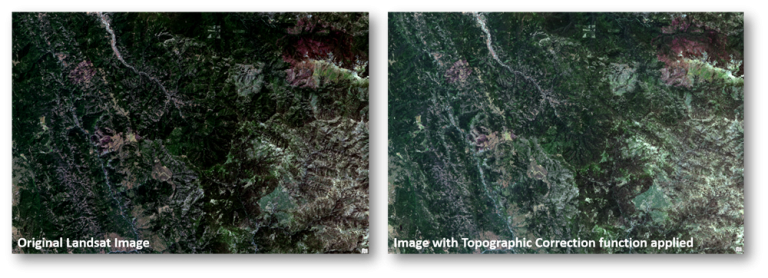
For example: Topographic Correction function
The Topographic C Correction function, written by Gregory Brunner from the St. Louis Regional Services office, essentially removes the hillshade from orthophotos. As you can imagine, imagery over mountainous areas or regions with rugged terrain can be difficult to classify accurately because pixels may belong to the same land cover class but some fall into shadow due to varying slopes and aspects. With the topographic correction function, you can get a better estimate of pixel values that would otherwise be impacted by hillshade. The result is a sort of flattening of the image, and it involves some fairly complex math.

Why should you care?
Okay, so now you know there’s a repository of Python raster functions. What’s next?
- Explore the functions you may need.
Some of the functions on the repository were written for specialized purposes and aren’t included with the ArcGIS installation, such as the Topographic C Correction function (above) or the Linear Spectral Unmixing function [contributed by Jacob Wasilkowski, also from the St. Louis Esri Regional office]. - Try writing your own Python raster function.
A lot of what’s on the GitHub repository is already in the list of out-of-the-box raster functions, but you can open the Python scripts associated with each one, customize them, and save them as new Python raster functions. This can be a great learning tool for those new to the process. - Watch the repo for more functions.
There are currently over 40 functions listed, and we are continually adding more. - Contribute!
Have you written something that you can share with the broader community? Do you have ideas for cool raster functions? Add to the conversation by commenting on GeoNet.
Get Started
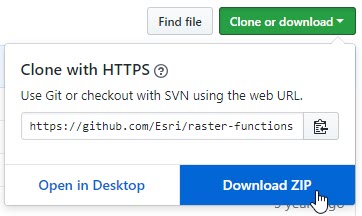
To easily access all the Python Raster Functions in the GitHub repository, simply click the Clone or Download button on the repository code page, and choose to download the raster functions as a ZIP file.

Extract the zip folder to your disk, then use this helpful Wiki to read about using the Python Raster Functions in ArcGIS Pro.
For an example tutorial on using the Python Raster Functions, check out the blog on the Aspect-Slope function.
Enjoy exploring!

Commenting is not enabled for this article.