Tropical storm Imelda (September, 2019) was the fifth wettest tropical cyclone on record in the continental United States. At one weather station in Jefferson County, Texas, over a meter of rain (43 inches) fell from this single storm.
Since the beginning of the 21st century, the Greater Houston area added nearly 2.8 million people. With the additional impervious urban landscape that goes along with all this added population, controlling runoff becomes a major concern. Rain that used to enter the water table through soil instead runs off into the stormwater system and into the bayous. How can we find out where the landscape has changed to hardscape since 2001?

We can see where the impervious surfaces changed by using definition queries and raster functions in ArcGIS Pro. Let’s use the new USA NLCD Impervious Surface Time Series layer to find out what areas have changed the most in the Houston area since 2001.
First, add the new USA NLCD Impervious Surface Time Series layer from the Living Atlas. To do this, open ArcGIS Pro, and insert a new map in your project if you don’t have one open already. Next click on add data in the map ribbon. Click on Living Atlas, and for the search term, type ‘impervious’. Click the layer called USA NLCD Impervious Surface Time Series and then click OK.

Now that the layer is in your map in ArcGIS pro, make a copy of the layer. To do this, right click the new item in the table of contents called USA NLCD Impervious Surface Time Series, and choose copy. Then right-click ‘map’ above the item and choose ‘paste’. You should have two identical layers, each called USA NLCD Impervious Surface Time Series.

At the left hand side of the time slider is a tiny icon with a clock on it. The icon appears when your mouse hovers over the time slider. When you hover over the icon itself, you can see that it says ‘Time disabled’. Click the icon to disable the time slider in the map.

Now, let’s rename each of these impervious surface time series layers. We’re going to create definition queries for each. The top layer will include a query which restricts the layer to just the images from 2016, while the bottom layer will include a query which restricts the layer to 2001. Click the name of the top one in the table of contents and type Impervious Surface 2016 to rename it. Do the same for the bottom one, but rename this one Impervious Surface 2001.

Let’s set the definition queries. Right click the top layer called Impervious Surface 2016. In the dialogue that comes up, click definition query. On the right, click new definition query. Then choose ProductName is equal to 2016. Click apply. Do the same for the lower layer, but set up a definition query that says ProductName is equal to 2001.

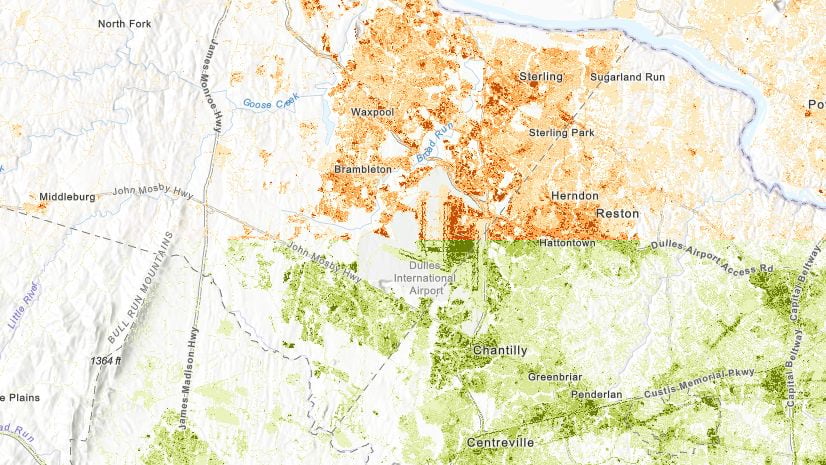
Zoom in to Houston, Texas, and turn the two layers on and off. By turning them off you can see the difference in impervious surface in Houston over the 18 year span of the data. (In that timeframe, Greater Houston’s population increased 65%.) You also have visual confirmation that you are viewing two different years of the same dataset.

Next let’s create a layer which shows the difference between the two years in a more logical way. If you haven’t yet used raster functions in ArcGIS Pro, then I’m excited to be introducing you this exciting part of ArcGIS Pro. To see the raster functions pane, click the imagery tab and click raster functions in the top ribbon. The raster functions tab will appear on the right.

Let’s set up a raster function to create a layer which shows the difference between the percent impervious in 2016 minus the percent impervious in 2001. For example, in the new layer, farmland that has been replaced by a highway will receive a value of 100, because an 100% impervious surface replaced a 0% impervious surface.

In the raster functions pane, choose the minus function. It’s under math. Where it says raster, choose the 2016 impervious surface. For raster2, choose the 2001 impervious surface. Then press the button that says create new layer. In a few seconds you have a virtual layer which shows the difference between the two dates. It will show them wherever you happen to zoom. Cool, huh?

As a suggestion, change the color ramp to display the layer a bit better, then also you can turn off the impervious layers.

With raster functions you see the result first, and then can write an area of the difference to disk if you want a more permanent raster layer for a particular area. To make a copy, use the copyraster tool in the data management toolbox, specifying the temporary raster layer as the input for the tool. Tip: In the environments tab of the copyraster dialogue, be sure to choose ‘same as display’ for the extent. This will copy only the image you see in the extent, the Houston area in our example.

Finally, let’s change some symbology on the temporary raster function layer so it can be understood in context. Right click the temporary raster function layer (called Minus_Impervious Surface 2016_Impervious Surface 2001) in the table of contents, and choose symbology. In the symbology dialogue, click the mask tab, and where it says display background value, check the box. Now the layer will display only what has changed. Places that did not change are now transparent.

Applying transparency to the temporary layer will help more context show through. To do this, click the layer in the table of contents, then under Raster Layer in the ribbon, choose Appearance. Move the slider in the appearance ribbon to 50% to make the layer 50% transparent.


Commenting is not enabled for this article.