If you’ve ever used a cased line symbol for roads you probably already know how useful the “Enable symbol layer drawing” checkbox can be.
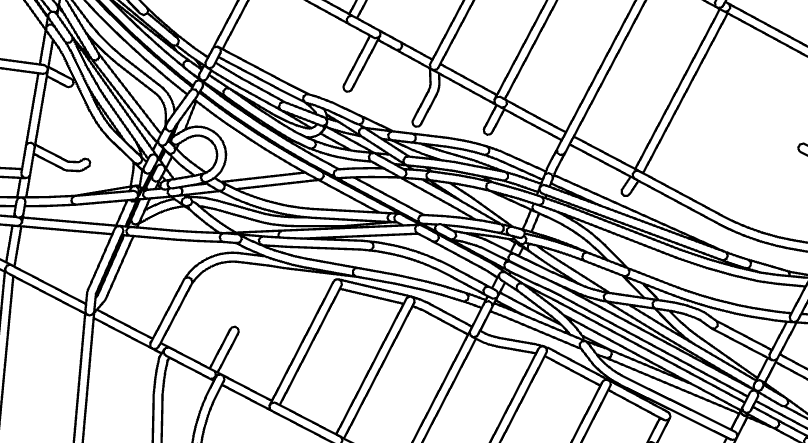
Without Symbol layer drawing:
With Symbol layer drawing:
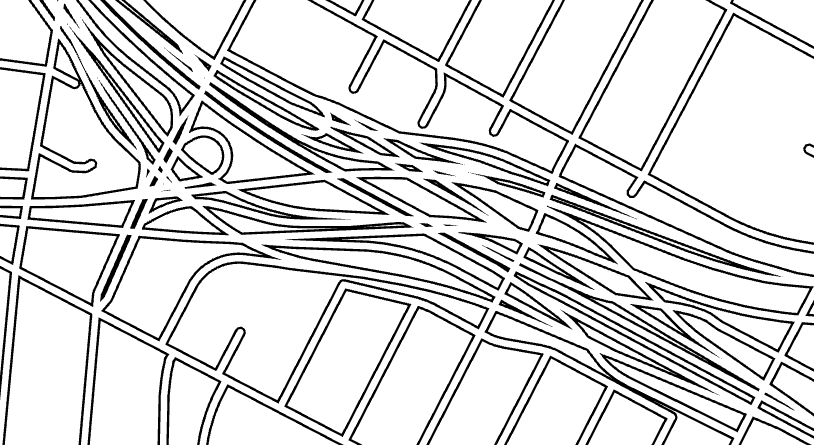
Whatever would you do without Symbol layer drawing?
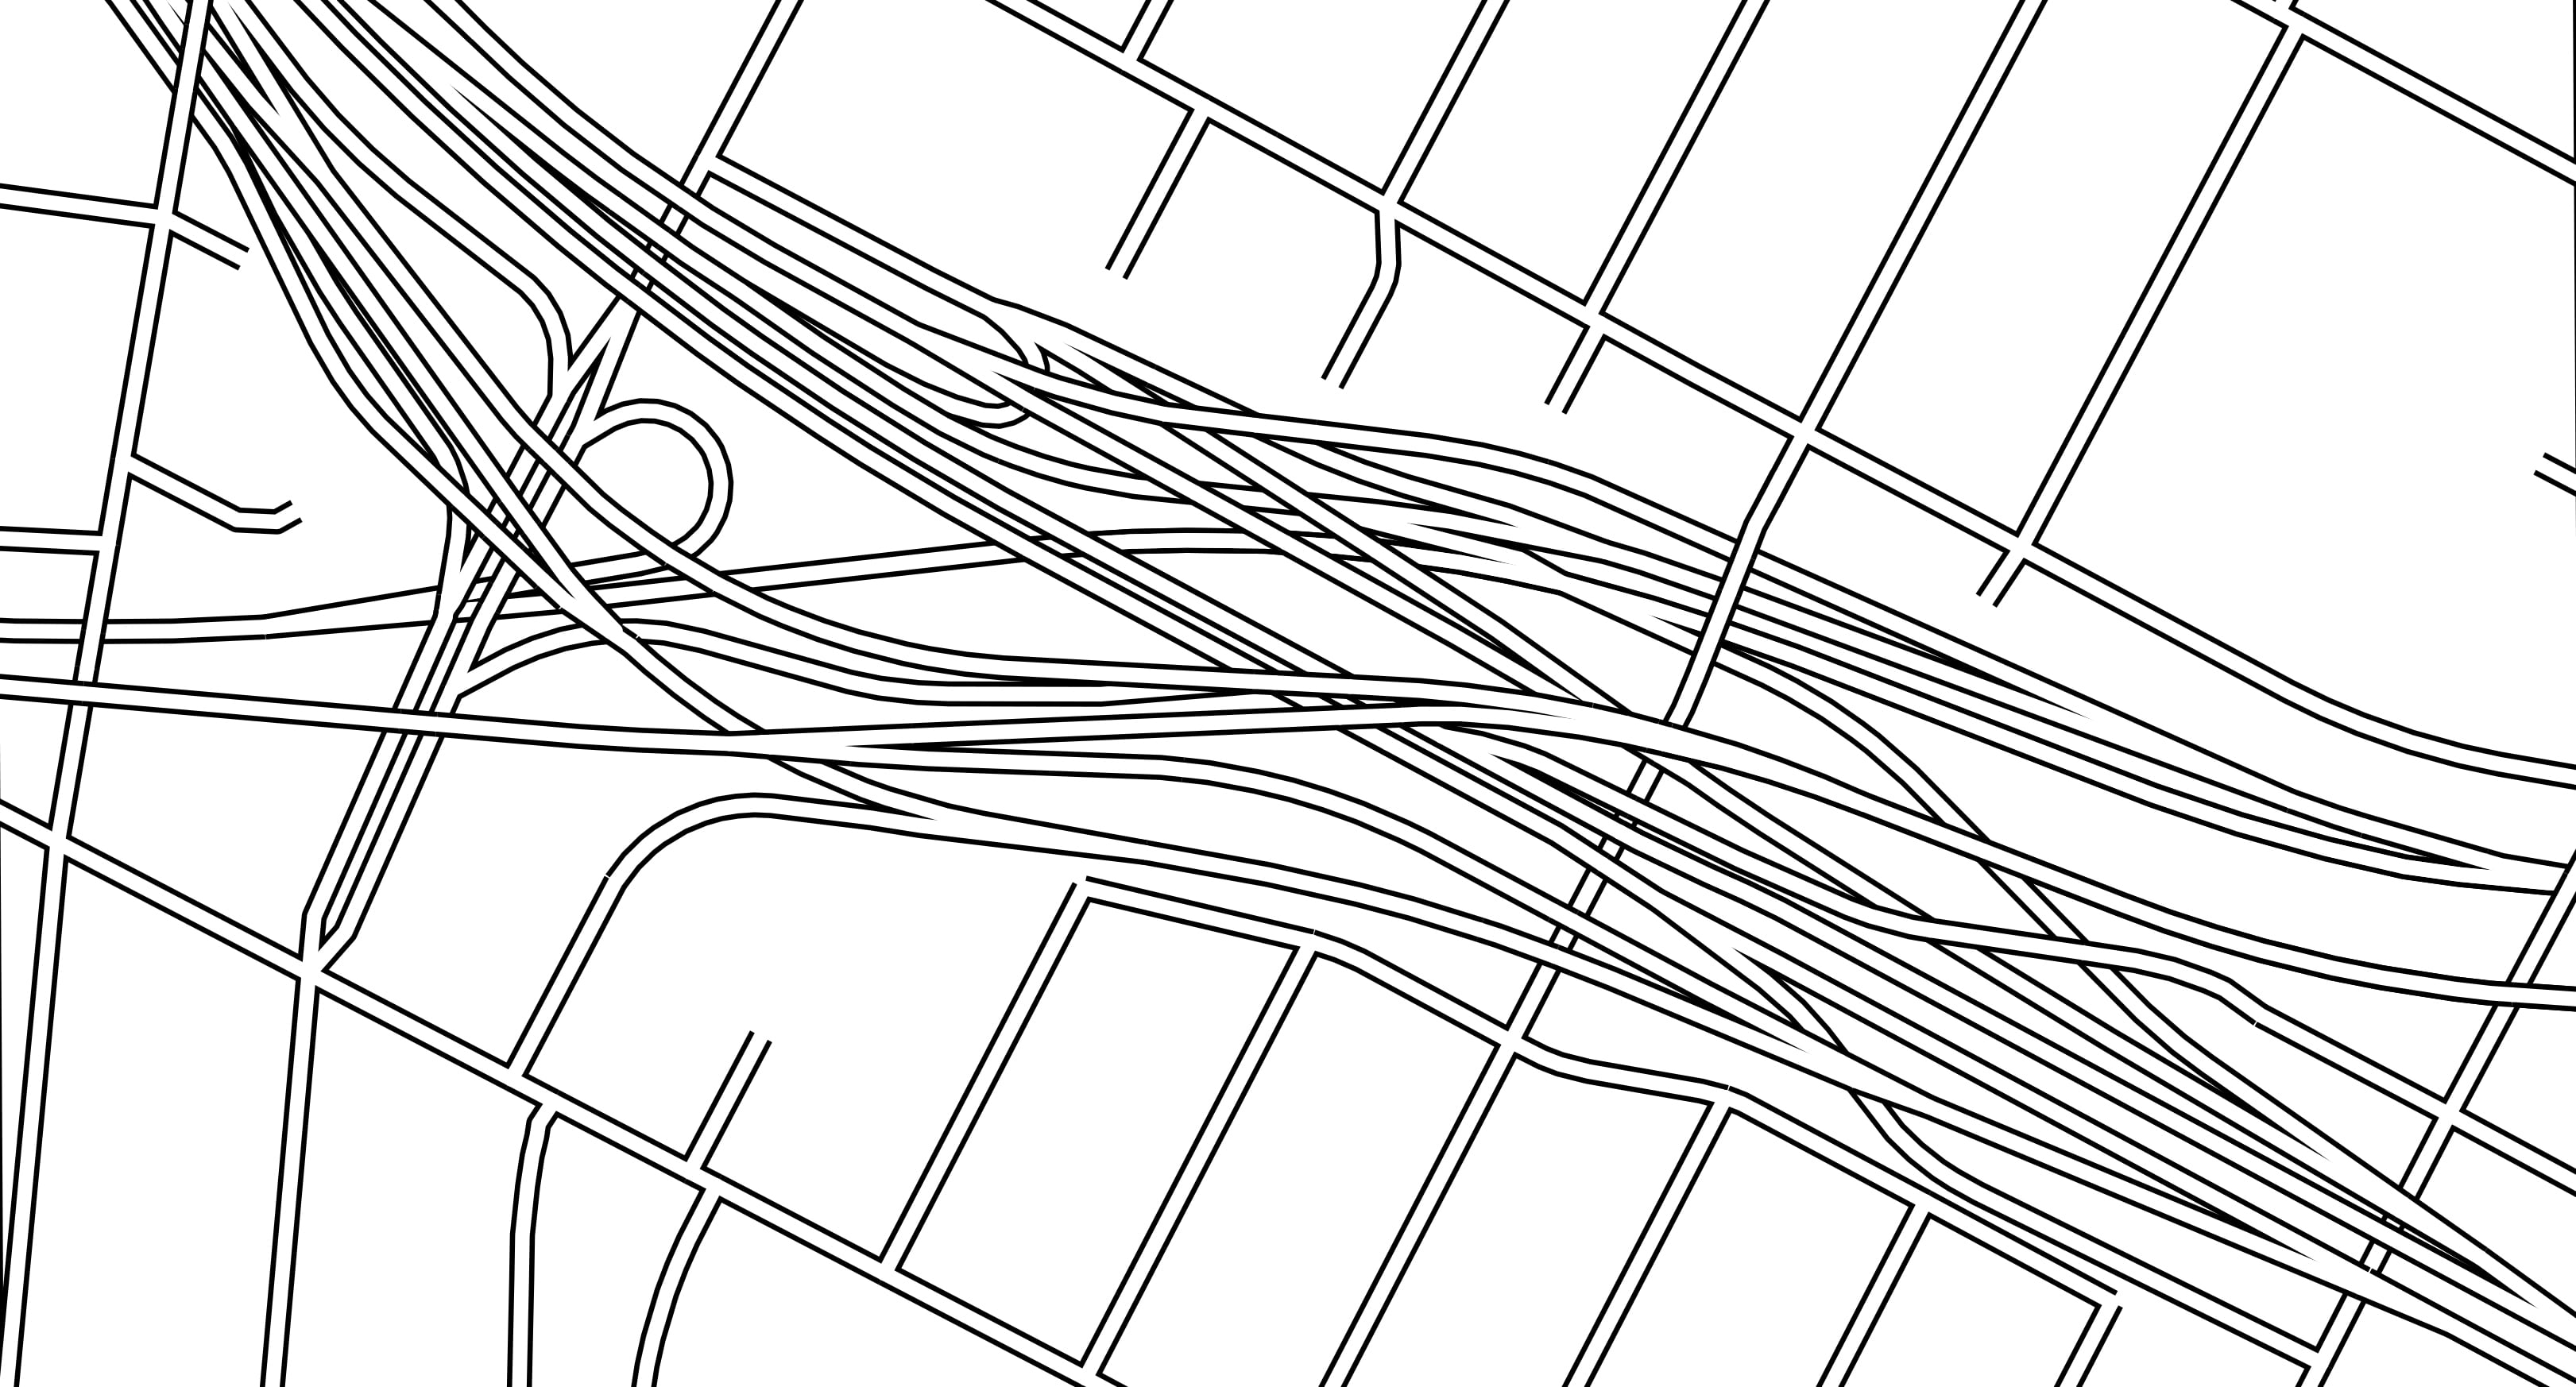
The example above is where the 60, 101 and 5 all converge in Boyle Heights, Los Angeles. It’s my favorite part of the grand-daddy of all interchanges: the East Los Angeles Interchange Complex. Obviously this is a tangled mess, and there’s no button you can push to instantly make the roads overlap and merge with one another in the correct order. But if you have a key interchange in your map that you need to clarify and untangle, this tutorial can show you how.
Step 1: Make a new numeric field on your layer called “DrawOrder.” Populate all of the rows with 0. Pick three random features and give them values of 1, 2, and 3. This is just to generate symbol classes, you’ll edit these values later.
Step 2: Symbolize the layer with Unique Values using the field DrawOrder. Add all values.
From the More menu on the Symbology pane, choose “Format all symbols”. From the symbol Gallery, choose the “Minor Road” symbol with a black outline:

Back on the Unique Values page, change the color scheme, perhaps to the random pastels scheme. The colors will only be applied to the fill, not the black outlines:
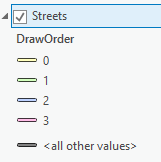
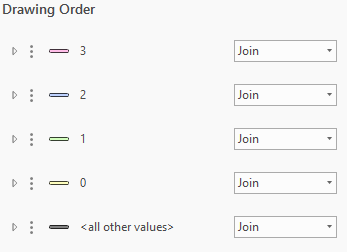
Step 3: Enable Symbol layer drawing. You can find this from the menu button in the top left of the Symbology pane. Reorder the symbol classes in descending order. They should all already be set to “Join.”
Step 4: Apply a reference scale to your map. I used 1:10,000, but as you start editing you may find a different scale works better for your map.
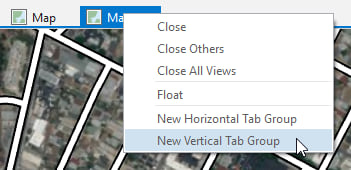
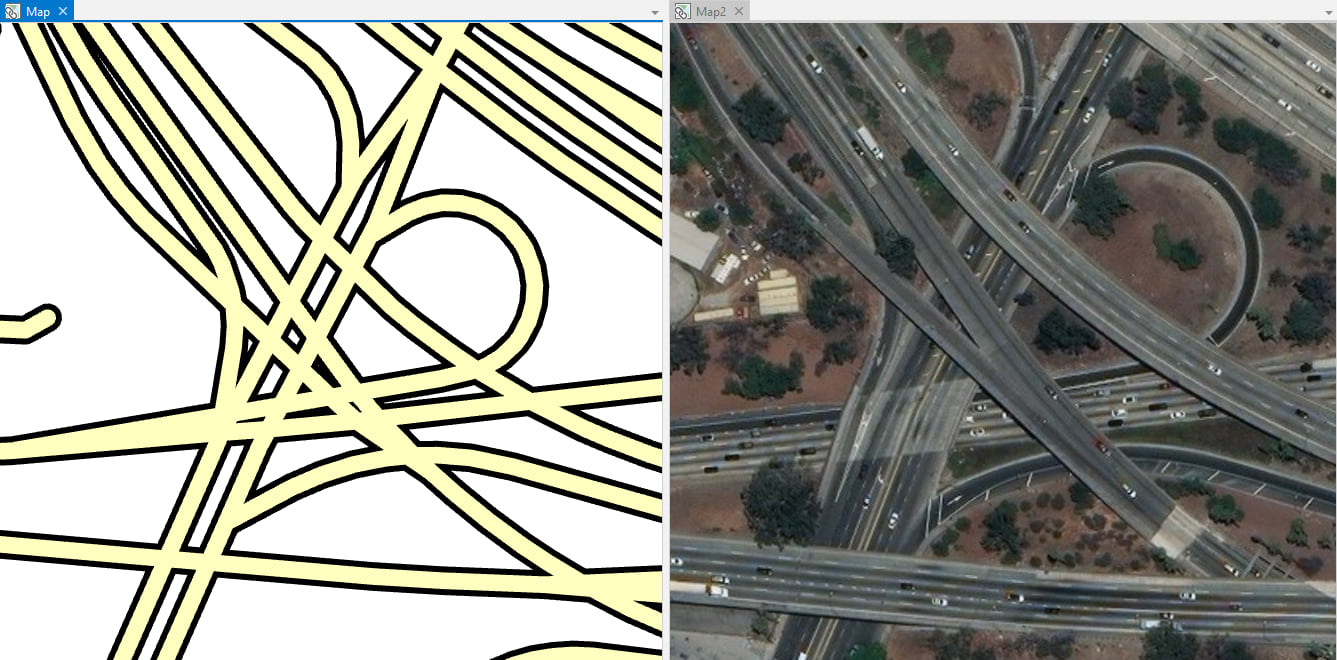
Step 5: Make a copy of your map and dock the two maps side by side:
On the View tab of the ribbon, choose to Link Views using the “Center And Scale” option.
On one map, turn off all layers except for roads. On the other map, turn off all layers except for the Imagery basemap. Now you have a reference visual of which roads overlap which:
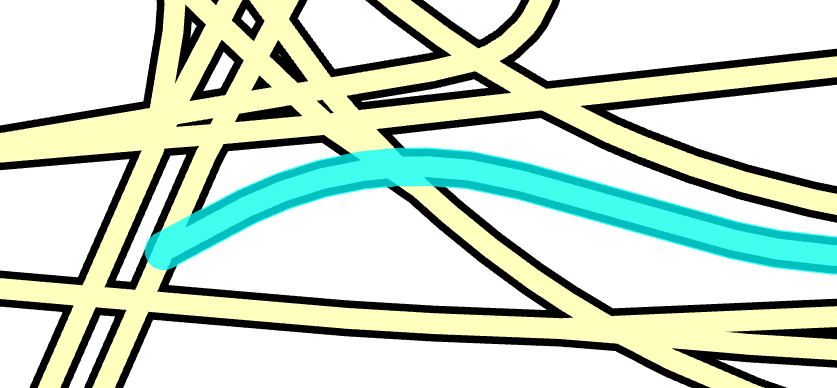
Step 6: Edit the roads. From the Edit tab on the ribbon, open the Attributes pane. Select a few connected road segments:
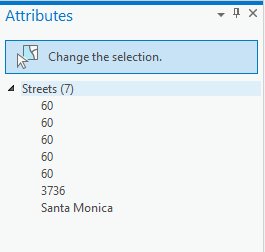
On the Attributes pane, make sure you select all of the segments by highlighting the layer name at the top of the list, instead of any of the individual features:
In the table on the Attributes pane, edit the DrawOrder value to be 0, 1, 2, or 3, based on where it belongs in the stack. On your map, the road should update to the new color and draw on top of or underneath the others.
Edit as many segments as you need until the roads overlap in the correct order.
Here’s a few tips:
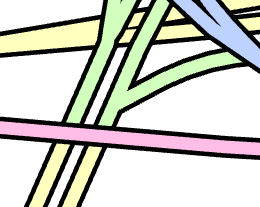
1. Remember that the colors are temporary and so do not need to be continuous. Their only function is to make it easier for you to remember what value each line segment has. If you have a road that needs to be level 0 on the north side of a crossroad, but level 1 on the south side, that’s fine:
2. This problem:
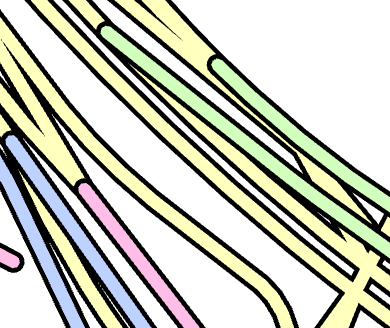
Is solved fairly easily.
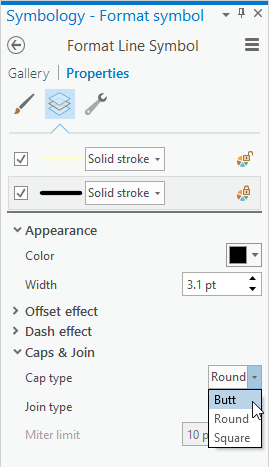
For each symbol class, open the symbol Properties to the Layers tab, and select the black stroke layer. Change Cap type to “Butt.”
Much better:
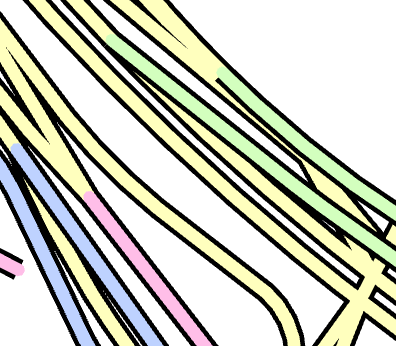
3. But you still might have ugly intersections:
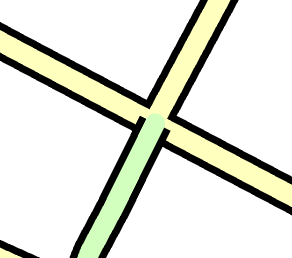
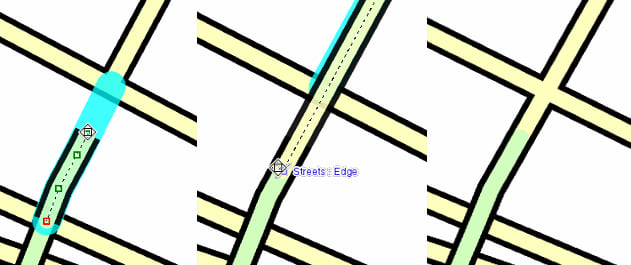
If this happens you can you move the transition point where the two line types meet. Use the Vertices edit tool to shorten one line and lengthen the other:
Step 7: When you’re finished editing, change the fill color of each symbol class to white. You now have ordered roads that better reflect the real world:

Commenting is not enabled for this article.