What happens when you have so much data that it’s impossible to know how many features are stacked up on top of each other? Is there a way to quantify them? Yes! How about visualizing the results? Sure!
Let’s dig in to this luscious repast of two weeks of FlightAware data over the Upper Midwest. See all that data?

It is a lot of data. Here’s a trick for at least being able to visualize where the clusters are. Push the individual feature’s transparency really high so you can get a sense for where it’s really stacked up…

This is enormously helpful from a visual perspective, and the airports and flightpaths become readily apparent. But there is little to be done about any sort of quantitative questioning. How many flights actually went overhead? For this, we’ll need to break out the cookie cutter and make a tessellation layer that can be used to count up the data that falls within. A tessellation is like a tiled floor where each tile is the same size and shape and there are no gaps.
Nature favors the hexagon for this sort of endeavor because it is at once the most geographically compact but geometrically complex shape. Who am I to resist?

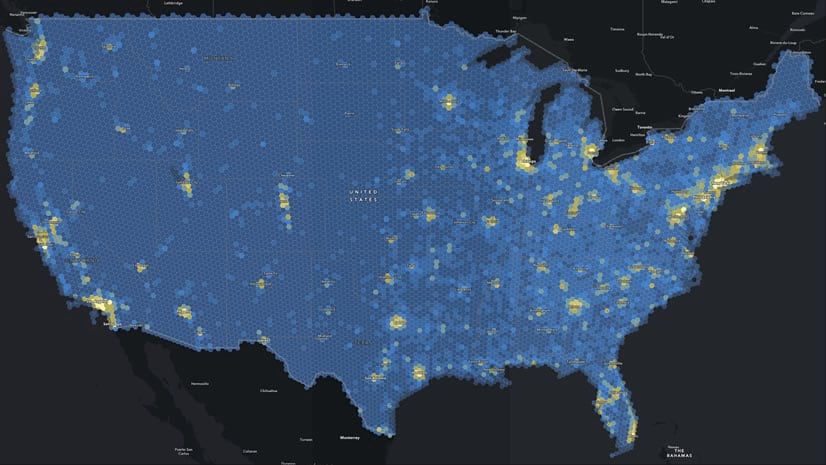
With hexagons stuffed with all manner of aggregated information about the data you can do all manner of analysis and reporting…and cartographic-izing! Here are some examples…


If you have ever had a problem with presenting and quantifying and reporting on heavily overlapping data, then do I have a video for you!
0:00 Rousing introduction.
0:21 Wow, check out how insanely dense that data is!
1:07 Time to put these data into some boxes. But first to make some boxes!
2:58 Spatial join, the most magical and quintessentially geographic of all geoprocessing tools, merges the attributes of one layer to the shapes of another layer, based on location!
4:26 But what about visualization? Here’s an example of a graduated color symbology.
6:10 Color is cool but size is best for showing magnitude. Here’s how to pry open that dimension.
7:40 Oh no but I miss the color! No problem, you can have both.
8:29 Hacking a 3D surface with the data. Probably not what you are expecting.
11:02 I’ve started saying thank you to teachers who have had a generous influence on my life. Thanks Dr. Bin Li!
Happy hexagonal mapping, John


Article Discussion: