
A lot of what we're mapping, even when it feels analytical, is driven by people's choices: where they live, what roads they use, when they seek healthcare. Keeping that connection between the data and the people behind it is important.
Like many cartographers, Peter Atwood’s journey to mapmaking took a circuitous route: Long before he was designing maps for Esri, he was tracing clues about past civilizations through archaeological site maps and fieldwork.
Those early experiences still shape his approach today, particularly his interest in the human stories behind data.
Now a Senior Cartographic Experience Designer at Esri’s Creative Lab, Peter creates maps and interactive experiences for Esri.com, events, marketing materials, and product demonstrations. His work explores maps not only as finished products, but also as tools for investigating questions and communicating complex information in intuitive ways.
We sat down with Peter to discuss his cartographic practice, his curiosities, and his go-to mapmaking toolkit. This interview has been edited for brevity and clarity.
Question: How did you find cartography — or did cartography find you?
Peter: I studied classics and archaeology, and during fieldwork projects we used GIS to map archaeological sites. I found that part of the work really interesting. At about the same time, I started making documentary video shorts and realized that maps were an effective way to communicate information about almost any topic. If I was exploring something I found interesting, making a map became a great way to synthesize what I’d learned.
That eventually led me to the cartography program at the Center of Geographic Sciences in Nova Scotia, followed by freelance work, municipal GIS, cartography for the Institute for Families in Society at the University of South Carolina, and ultimately Esri.
Q: How has your background in archaeology shaped your approach to cartography?
Peter: What I really enjoyed about archaeology, and what still translates to cartography, is using data to understand human experiences and human stories.
A lot of what we’re mapping, even when it feels analytical, is driven by people’s choices: where they live, what roads they use, when they seek healthcare. Keeping that connection between the data and the people behind it is important.
When I worked as a GIS analyst with a team doing healthcare research in South Carolina, one lesson that stuck with me was that you couldn’t understand disparities just by looking at the numbers. You had to talk to people and understand the cultural factors behind those decisions. I still try to carry that perspective into my work.
Q: How do you explore a dataset and identify something worth mapping?
Peter: Sometimes the dataset drives the story. For example, I’ll be browsing Living Atlas and come across something like records of every 911 call and immediately think, “There are a hundred different stories in here.”
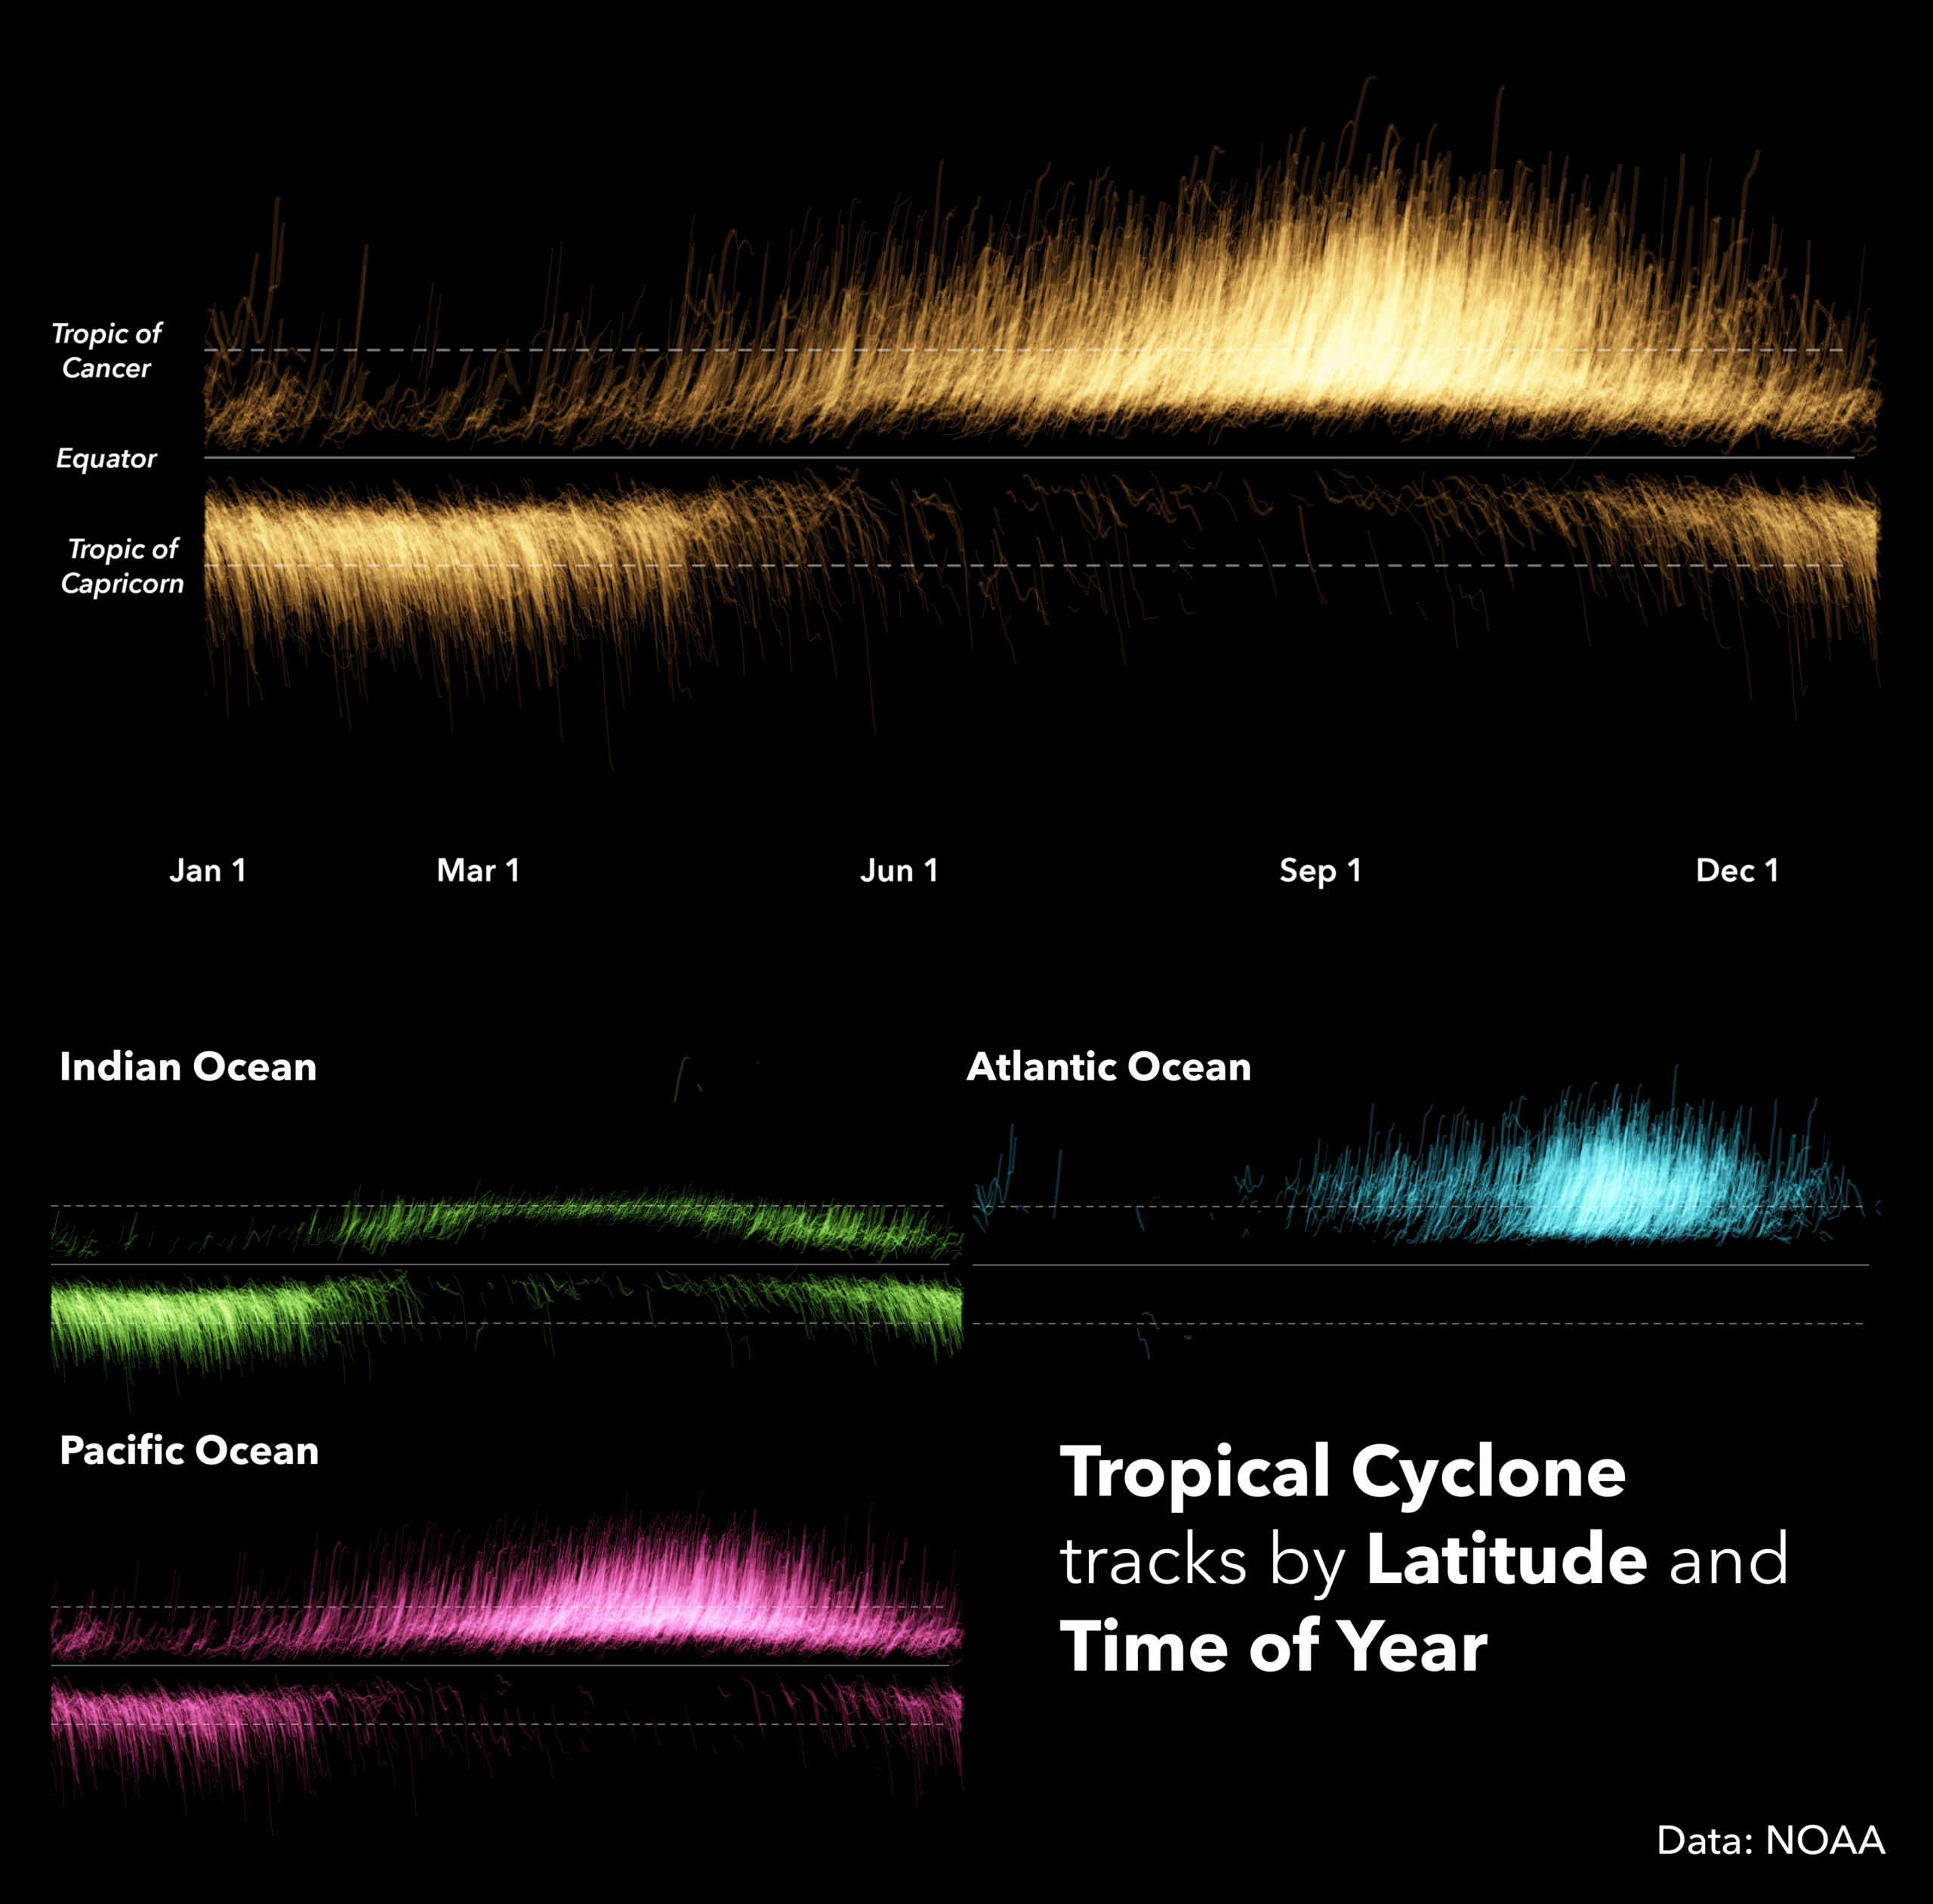
I try to get data onto a map as quickly as possible. Rather than spending a lot of time looking through tables, I’d rather dump everything onto a canvas and see what patterns emerge.
One trick I use with dense point datasets is to make them almost completely transparent. The structure often reveals itself through clustering and overlap. From there, I’ll experiment with classifications, symbology, and different variables to see what stories start to emerge.
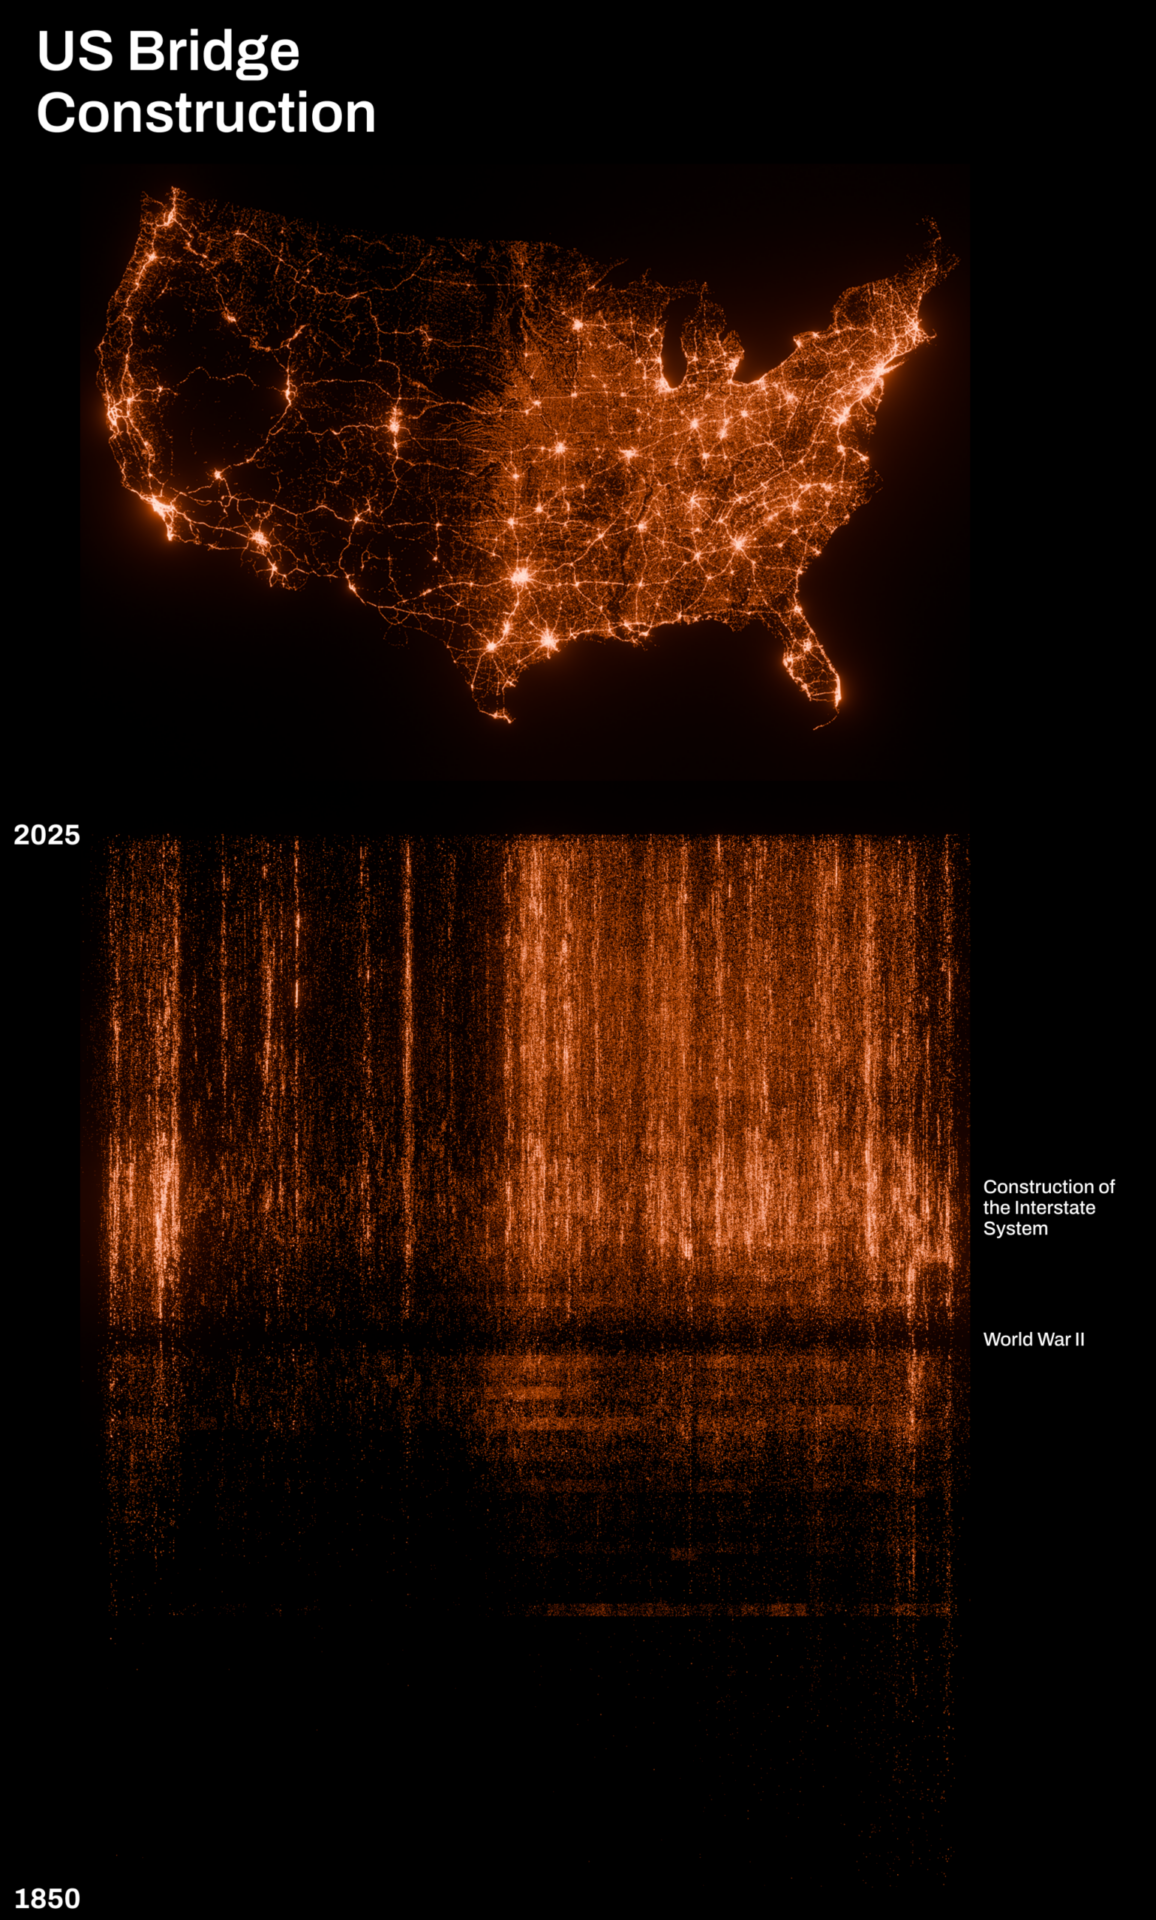
Q: The transparency trick is great for quickly highlighting patterns in point data. What other tools or techniques do you find yourself reaching for most often?
Peter: Arcade and symbol property connections are two that I use constantly.
Arcade lets me move beyond what’s in the attribute table and create information that’s closer to what I actually want to visualize. Symbol property connections then let me connect design decisions directly to the data.
I’m also a big fan of masking. One example involved using live hurricane forecast cones as masks over a nighttime lights map to highlight the population centers that might be affected by a storm. It’s a simple technique, but it’s incredibly powerful for directing attention.
Q: What projects or ideas are exciting you right now?
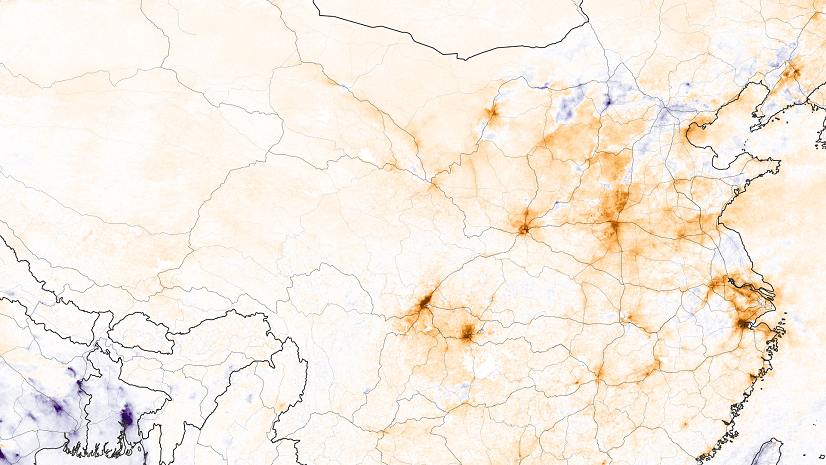
Peter: I’ve been experimenting with Copernicus atmospheric and ocean data, creating animations that show how wind and ocean currents move across the globe.
The idea came from thinking about how we actually experience those systems. We don’t experience “wind data.” We experience leaves blowing through the air or objects being carried by currents. I’m interested in creating visualizations that connect those datasets back to lived experience.
I’m also always interested in archaeology-related data. LiDAR datasets, for example, can reveal traces of historic structures and landscapes that are almost invisible on the ground.
Q: Your maps are not just illuminating, but also visually stunning. What principles guide your visual design?
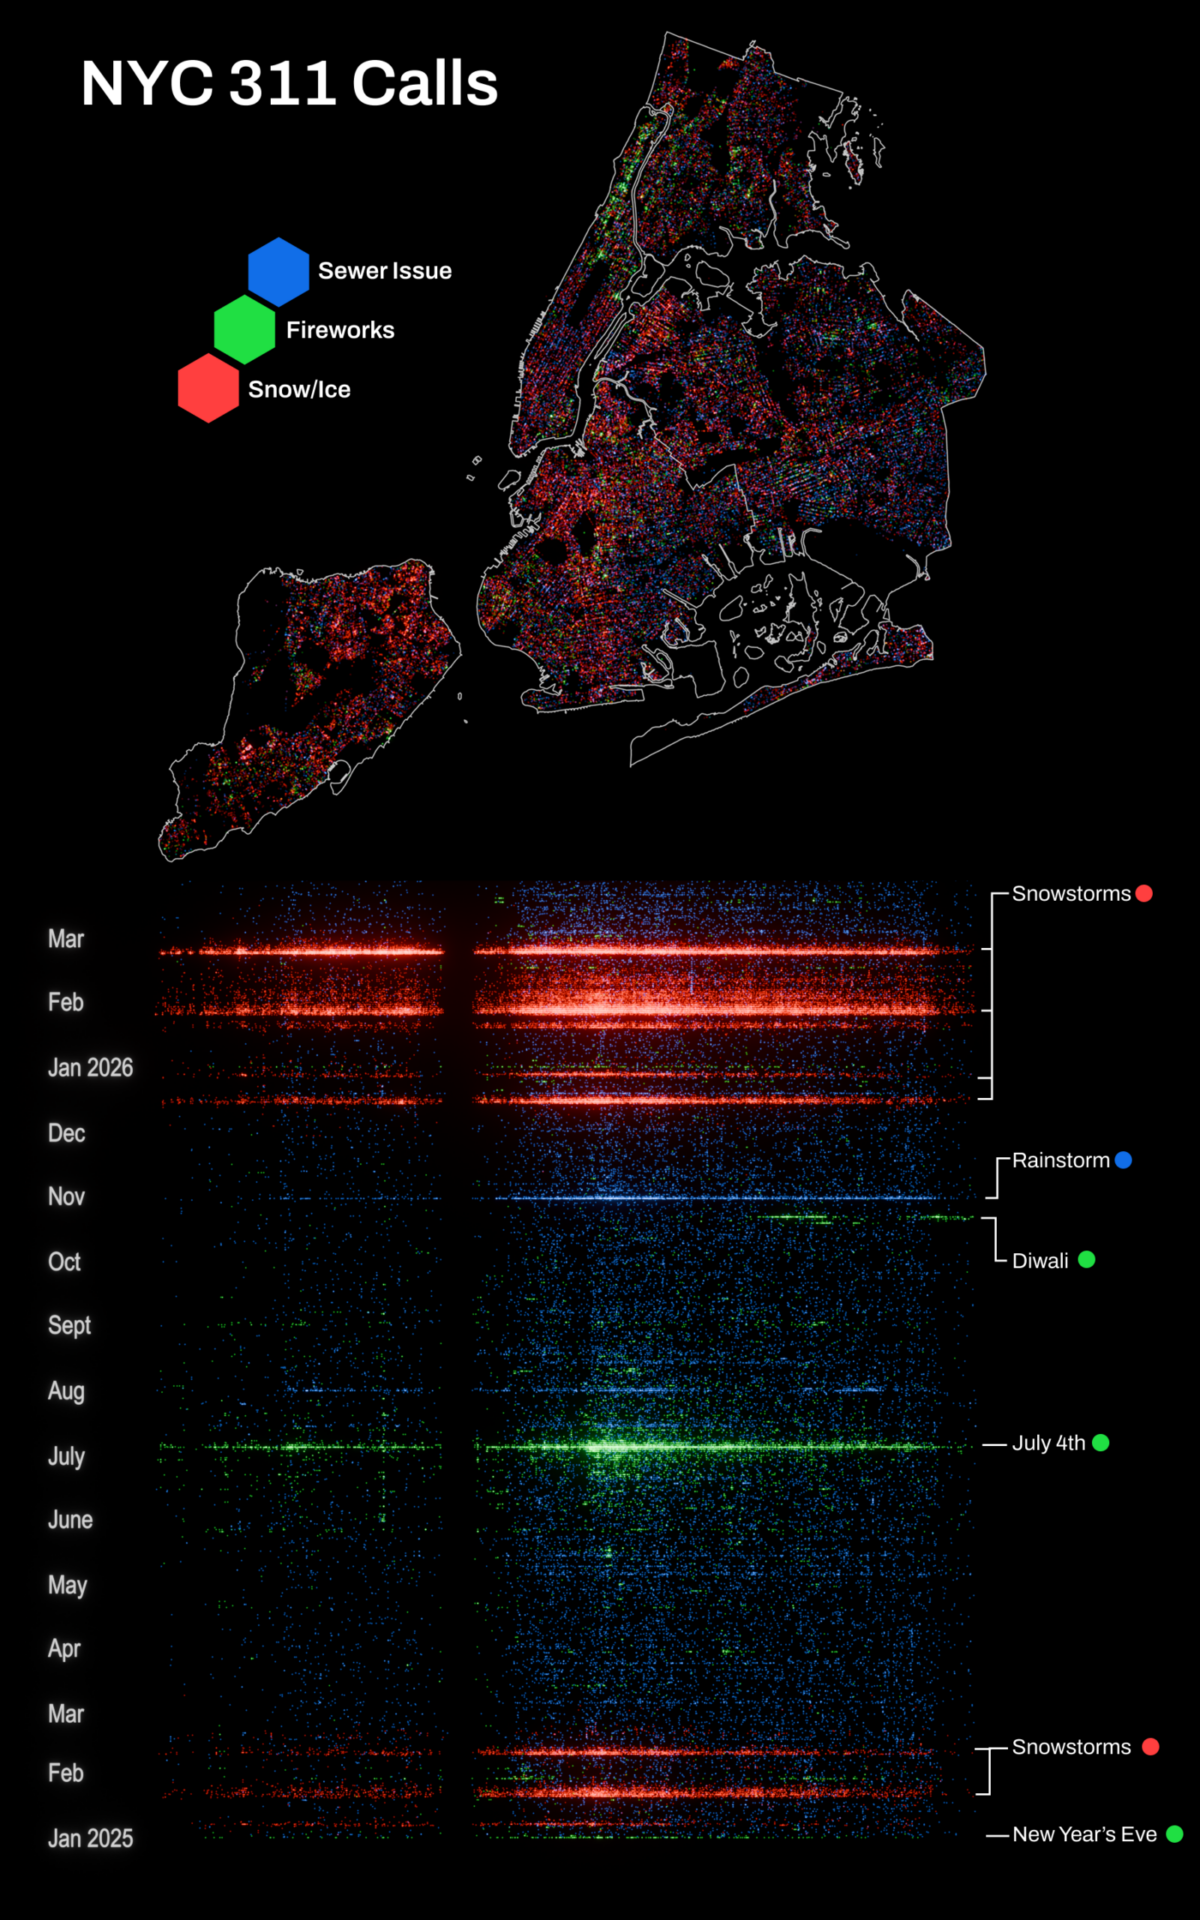
Peter: I like borrowing cues from the physical world. People already understand things like color, light, shadow, and texture intuitively. Those cues can make a map easier to understand without requiring someone to learn a new visual language.
That’s part of why I’m interested in tactile design and analog media. I love seeing hand illustration incorporated into maps and looking at how artists use photographs and real-world textures in digital work. Those approaches can make digital experiences feel more grounded and more human.
Q: What advice would you give aspiring mapmakers?
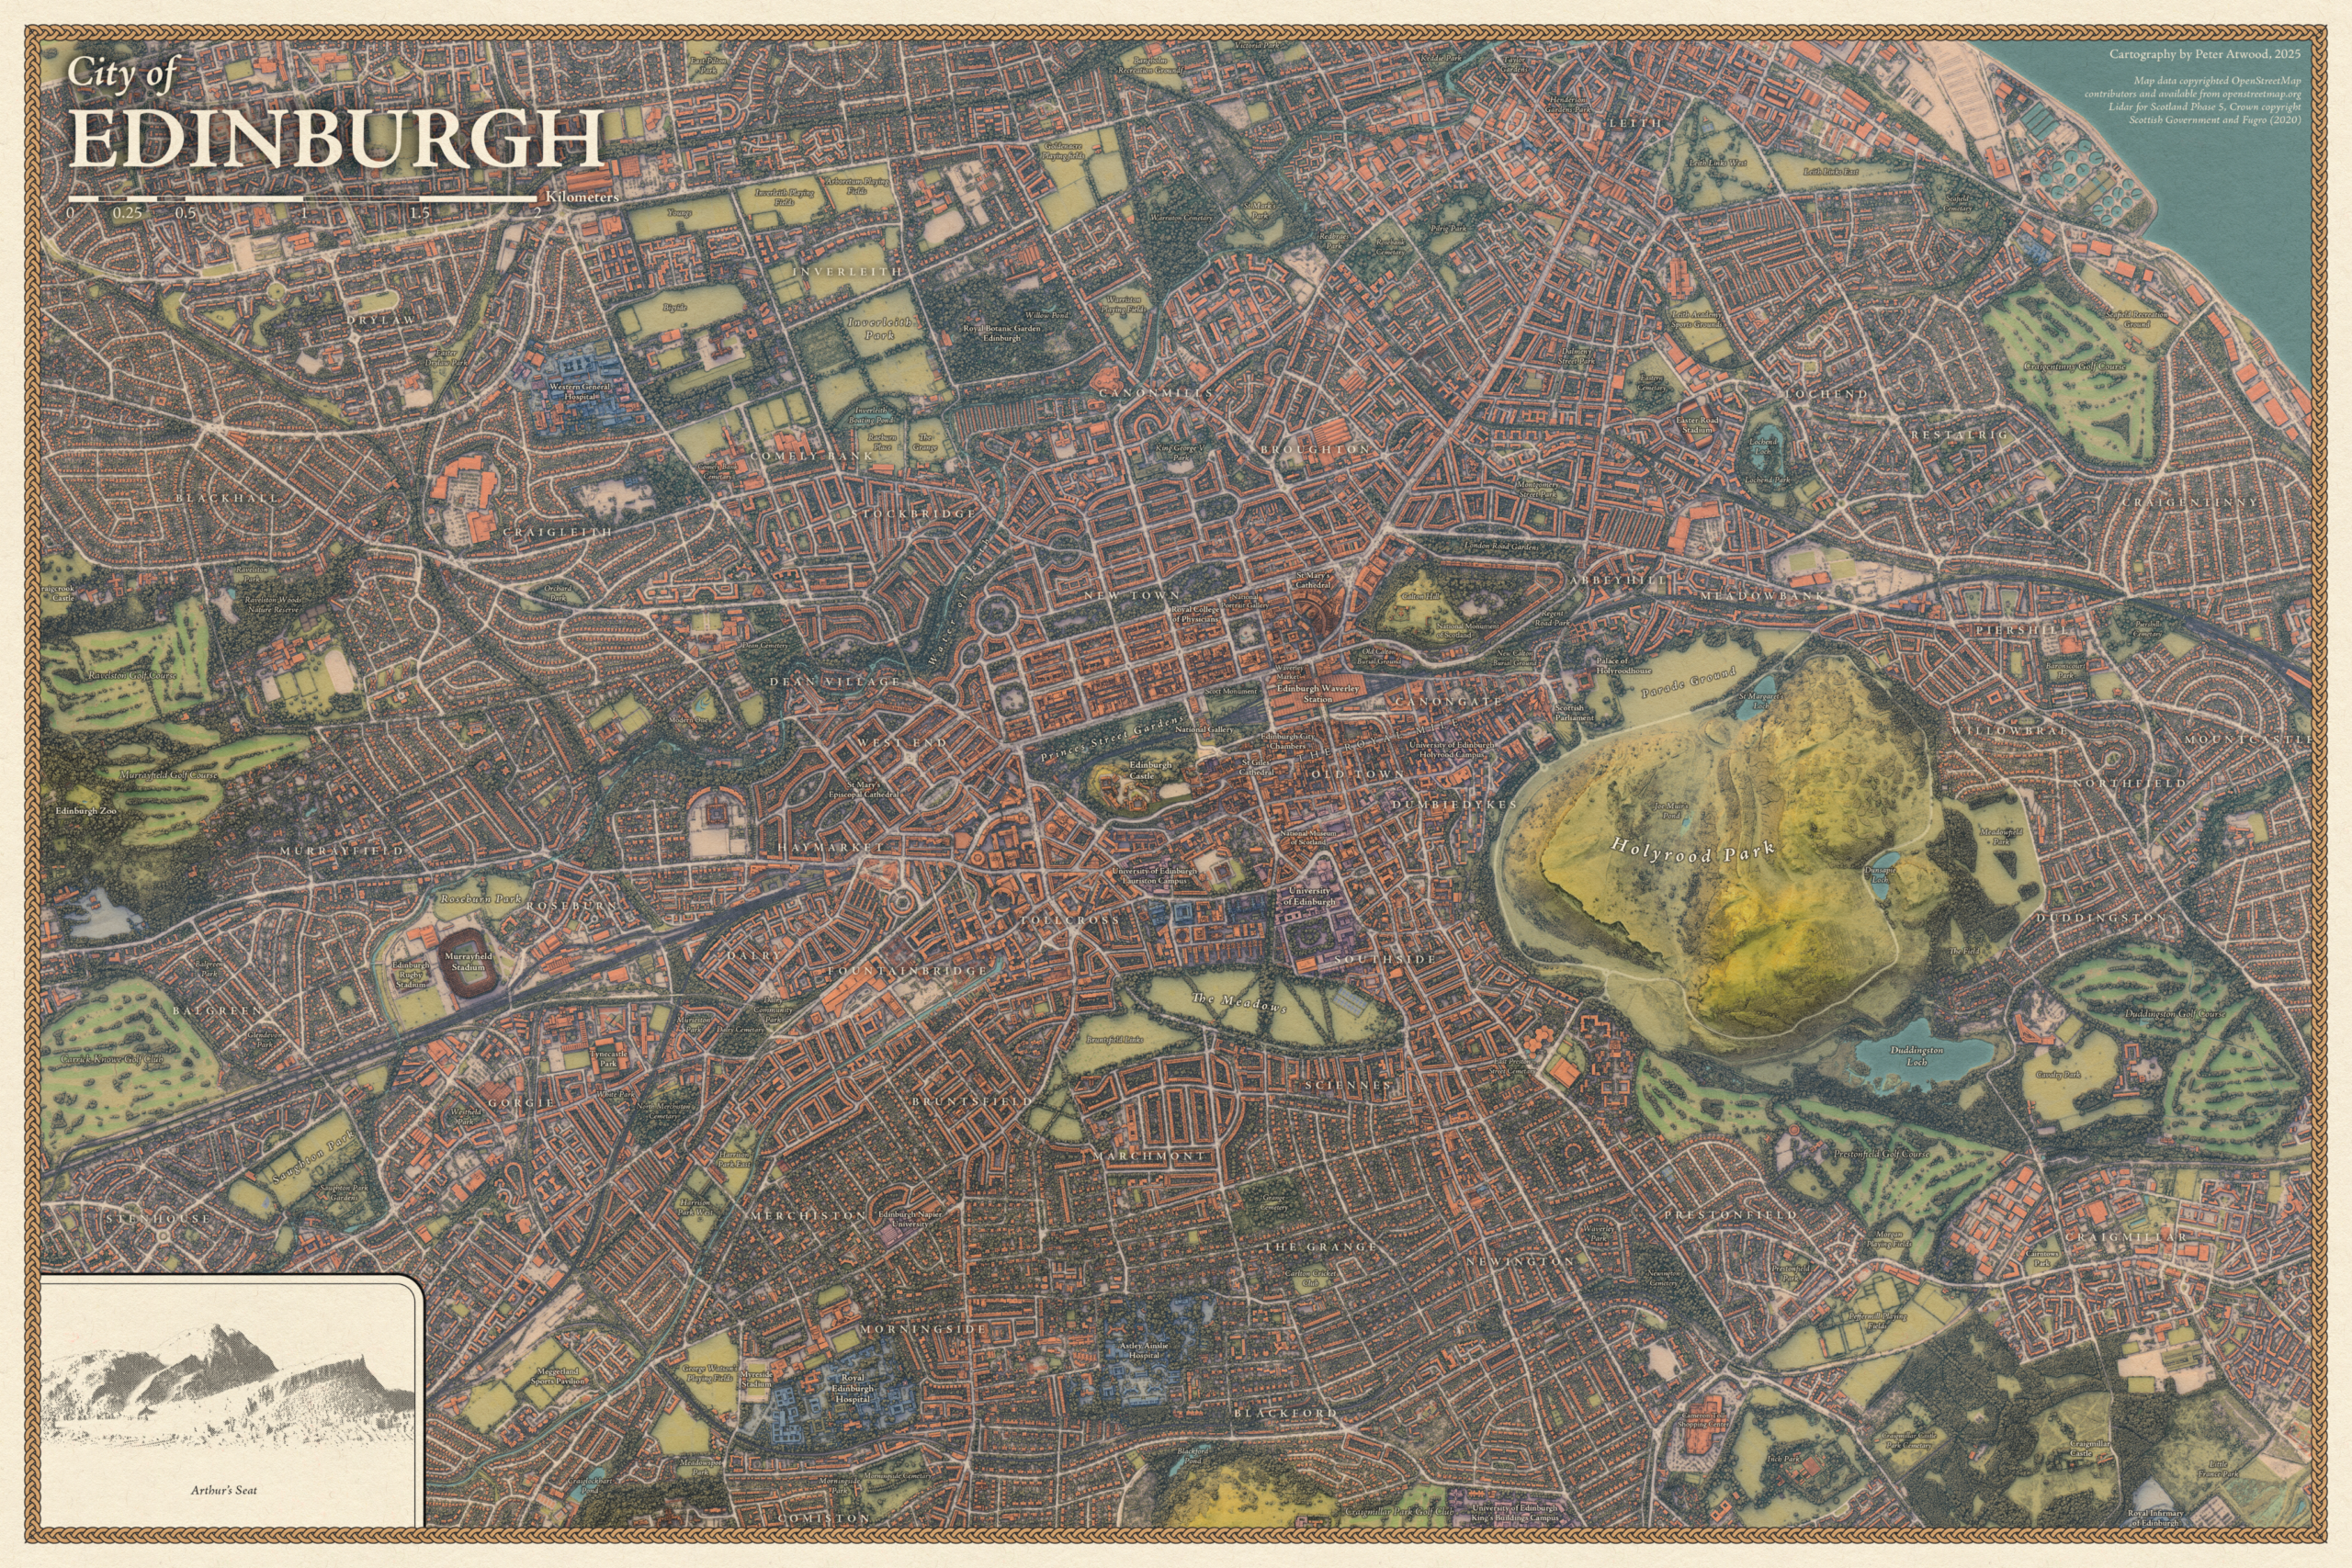
Peter: Find topics that genuinely interest you.
When you’re building skills in design, analysis, and data, it’s much easier if you’re exploring something you’re actually curious about. Whatever your interests are, there’s probably data that lets you go down some rabbit hole.
The maps that made up my early portfolio were all projects I could talk about for hours because I cared about them. Those were also the ones that turned out the best.
Q: It could be said that we are living in a golden age of digital mapmaking. As interactive tools become more accessible, what excites you most and what concerns you?
Peter: I’m really interested in designing more intentionally for interactive experiences. Interactivity opens up a lot of exciting storytelling possibilities, and I’ve been spending more time exploring StoryMaps and web-based experiences.
At the same time, it’s become incredibly easy to build complicated things. The challenge isn’t adding more information. It’s deciding what people actually need to understand the story.
If there’s complexity, let people access it when they want to. Let them dive deeper through pop-ups and secondary experiences. But don’t overwhelm them immediately.
Especially now that it’s so easy to create complicated experiences with the help of agentic development tools, I think there’s a renewed need to be intentional about clarity.
This featured storyteller interview was prepared as a part of the November 2026 issue of StoryScape℠.
For more interviews and articles like this one, be sure to check out StoryScape℠, a monthly digital magazine for ArcGIS StoryMaps that explores the world of place-based storytelling — with a new theme every issue.


Commenting is not enabled for this article.